Morning, morning, morning! ☀️⚡
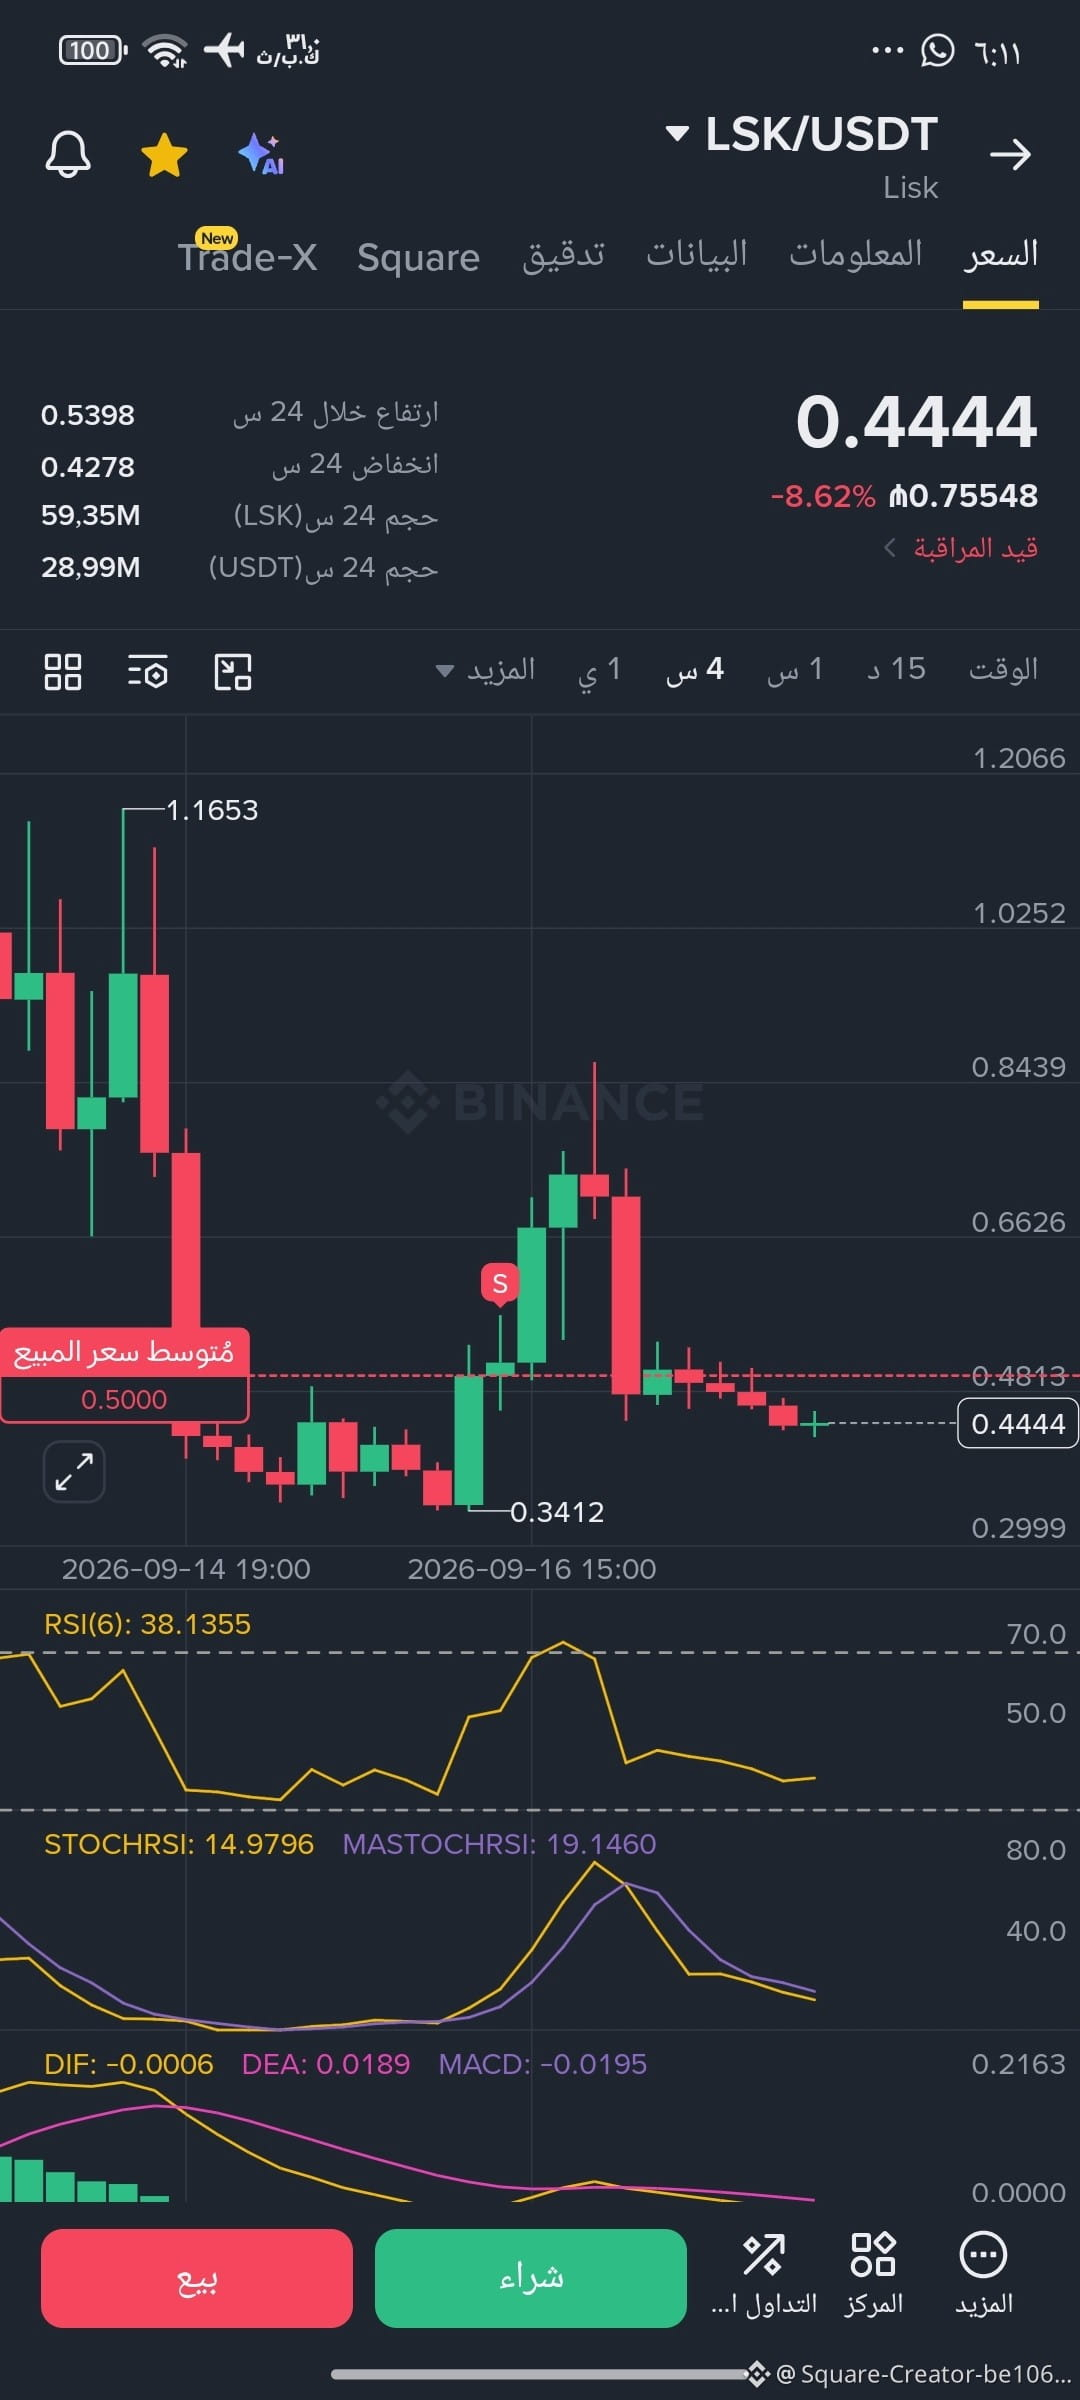
O morning of activity and opportunities! Take a look at the chart for LSK today and judge for yourselves—do you think it will rise or fall in the next period? 🤔
Quick, unbiased read of the chart:
Current price: It’s sitting at $0.4444 after a sequence of correction and consecutive pullbacks.
Key support zones: Price is approaching previous support areas around $0.3412–$0.4000—zones from which the price previously bounced strongly.
Technical indicators (RSI & StochRSI): The indicators have reached oversold levels, which may suggest a possible rebound for traders. However, after the large red candle, the broader trend needs confirmation—specifically a break and hold above the $0.5000 level to regain bullish momentum.
Reasonable takeaway: The current move looks like accumulation or a period of consolidation after a decline. The decision requires watching for either a support break or a resistance breakout.
So what do you think? Share your predictions in the comments: up 🚀 or down 📉?
Wishing everyone a successful day and profits on your side! 💼✨
#LSK
O morning of activity and opportunities! Take a look at the chart for LSK today and judge for yourselves—do you think it will rise or fall in the next period? 🤔
Quick, unbiased read of the chart:
Current price: It’s sitting at $0.4444 after a sequence of correction and consecutive pullbacks.
Key support zones: Price is approaching previous support areas around $0.3412–$0.4000—zones from which the price previously bounced strongly.
Technical indicators (RSI & StochRSI): The indicators have reached oversold levels, which may suggest a possible rebound for traders. However, after the large red candle, the broader trend needs confirmation—specifically a break and hold above the $0.5000 level to regain bullish momentum.
Reasonable takeaway: The current move looks like accumulation or a period of consolidation after a decline. The decision requires watching for either a support break or a resistance breakout.
So what do you think? Share your predictions in the comments: up 🚀 or down 📉?
Wishing everyone a successful day and profits on your side! 💼✨
#LSK