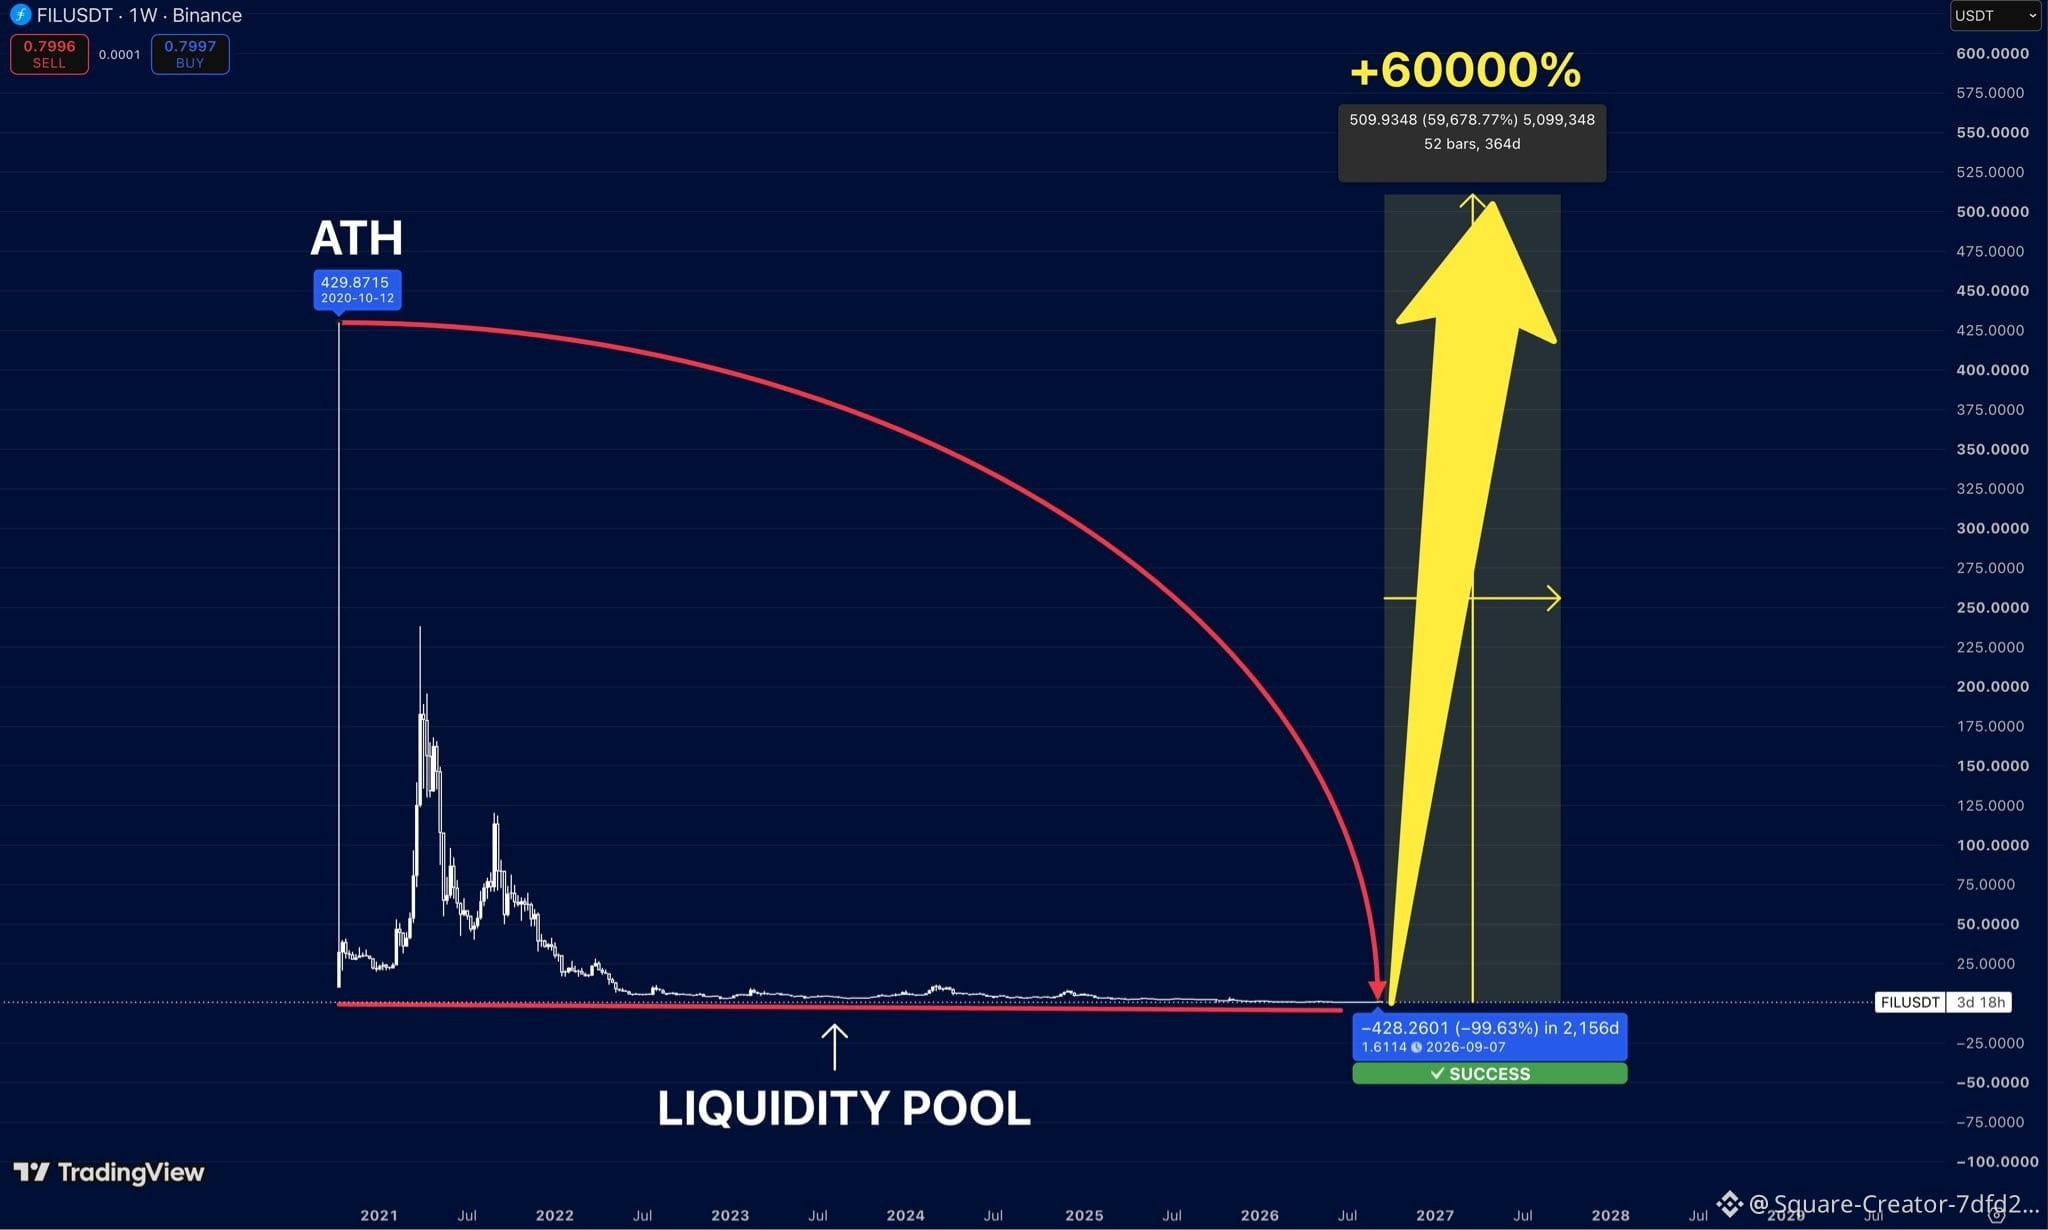
The price of $FIL has dropped by 99.6% from its all-time high.
Read that again.
Most people see a chart like this and think it’s over.
I see years of falling prices accumulating in the same liquidity pool.
And this is where things start getting crazy:
Reverting back to the old range will lift $FIL by hundreds of dollars.
The scenario shown in my chart points to a price above $500.
Based on current levels, that’s approximately +60,000%.
Am I expecting a straight line? Of course not.
But that’s exactly the kind of asymmetric chart
I want to be ahead of the curve before everyone starts talking about it again.
Read that again.
Most people see a chart like this and think it’s over.
I see years of falling prices accumulating in the same liquidity pool.
And this is where things start getting crazy:
Reverting back to the old range will lift $FIL by hundreds of dollars.
The scenario shown in my chart points to a price above $500.
Based on current levels, that’s approximately +60,000%.
Am I expecting a straight line? Of course not.
But that’s exactly the kind of asymmetric chart
I want to be ahead of the curve before everyone starts talking about it again.