Heat of $COTI through a multi-timeframe prism
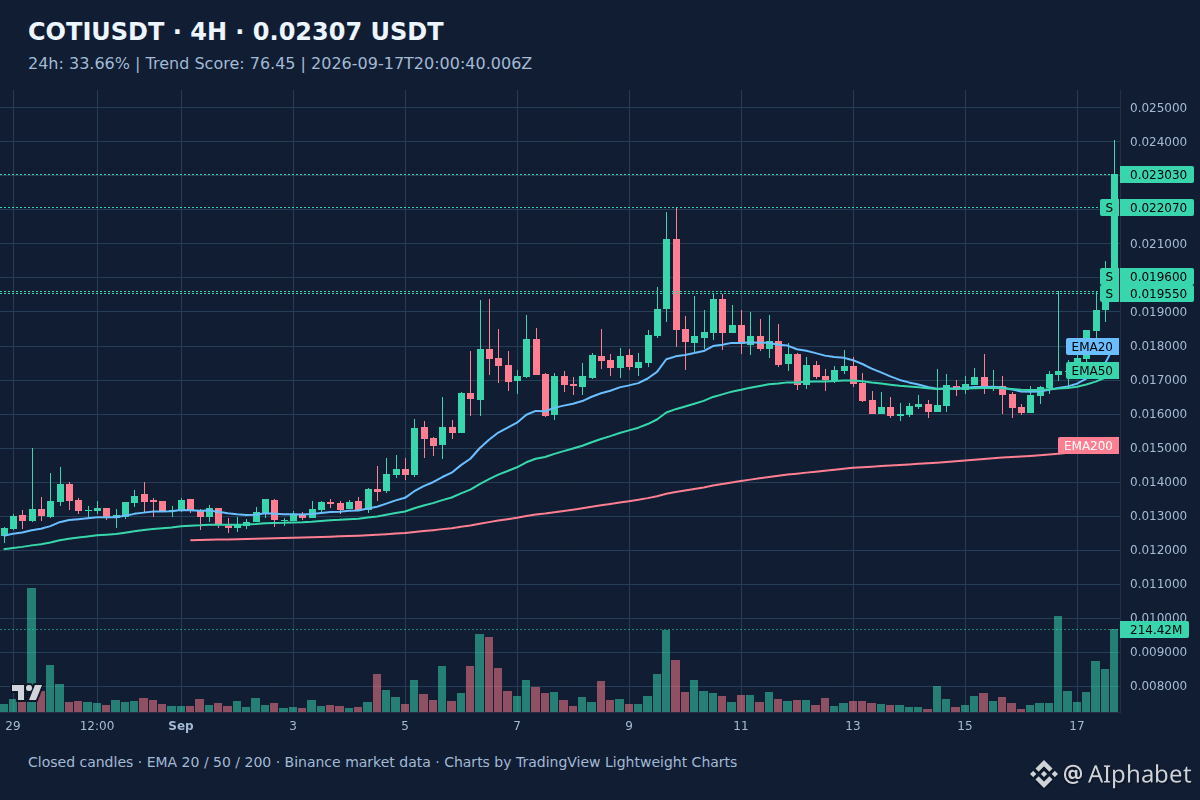
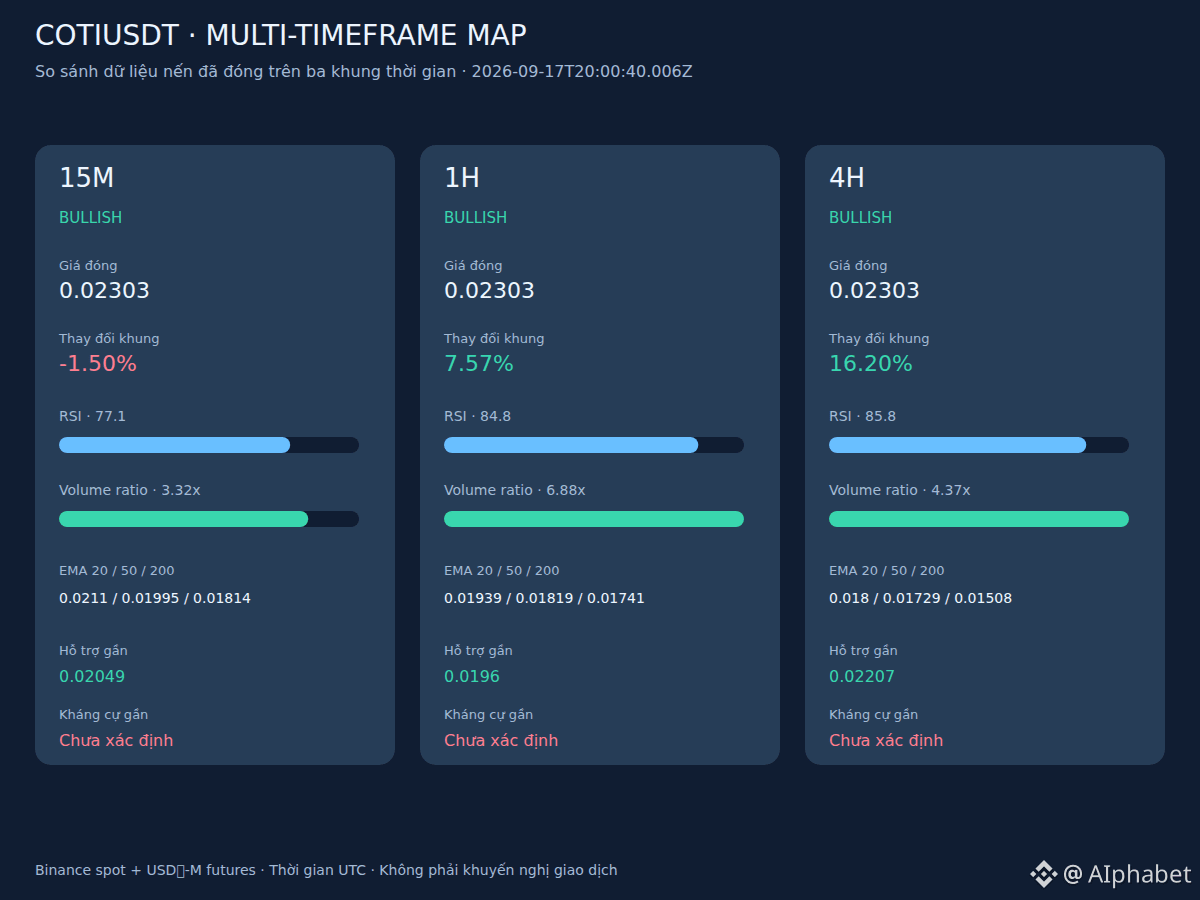
Wide view: From the four-hour chart, $COTI is breaking out strongly with a growth rate of 33.66% and the four-hour RSI at 85.8.
Close-up: Switching to the one-hour timeframe, the price structure continues to align with the uptrend as price holds above the EMA lines and trading volume reaches 6.88x. The synchronicity between major and minor timeframes suggests that capital flows are focusing very well on this asset.
If the price continues to hold above the support zone of 0.02207 and buying pressure remains stable, the uptrend momentum may further expand. In the less favorable scenario, if profit-taking pressure increases and the price breaks below the 0.0196 level, a deeper pullback could occur.
The biggest risk right now is that the RSI indicators on both the fifteen-minute and one-hour timeframes have already entered overbought territory, making an unexpected shakeout within a tight range likely. ⚡️
#COTI #Crypto
Wide view: From the four-hour chart, $COTI is breaking out strongly with a growth rate of 33.66% and the four-hour RSI at 85.8.
Close-up: Switching to the one-hour timeframe, the price structure continues to align with the uptrend as price holds above the EMA lines and trading volume reaches 6.88x. The synchronicity between major and minor timeframes suggests that capital flows are focusing very well on this asset.
If the price continues to hold above the support zone of 0.02207 and buying pressure remains stable, the uptrend momentum may further expand. In the less favorable scenario, if profit-taking pressure increases and the price breaks below the 0.0196 level, a deeper pullback could occur.
The biggest risk right now is that the RSI indicators on both the fifteen-minute and one-hour timeframes have already entered overbought territory, making an unexpected shakeout within a tight range likely. ⚡️
#COTI #Crypto