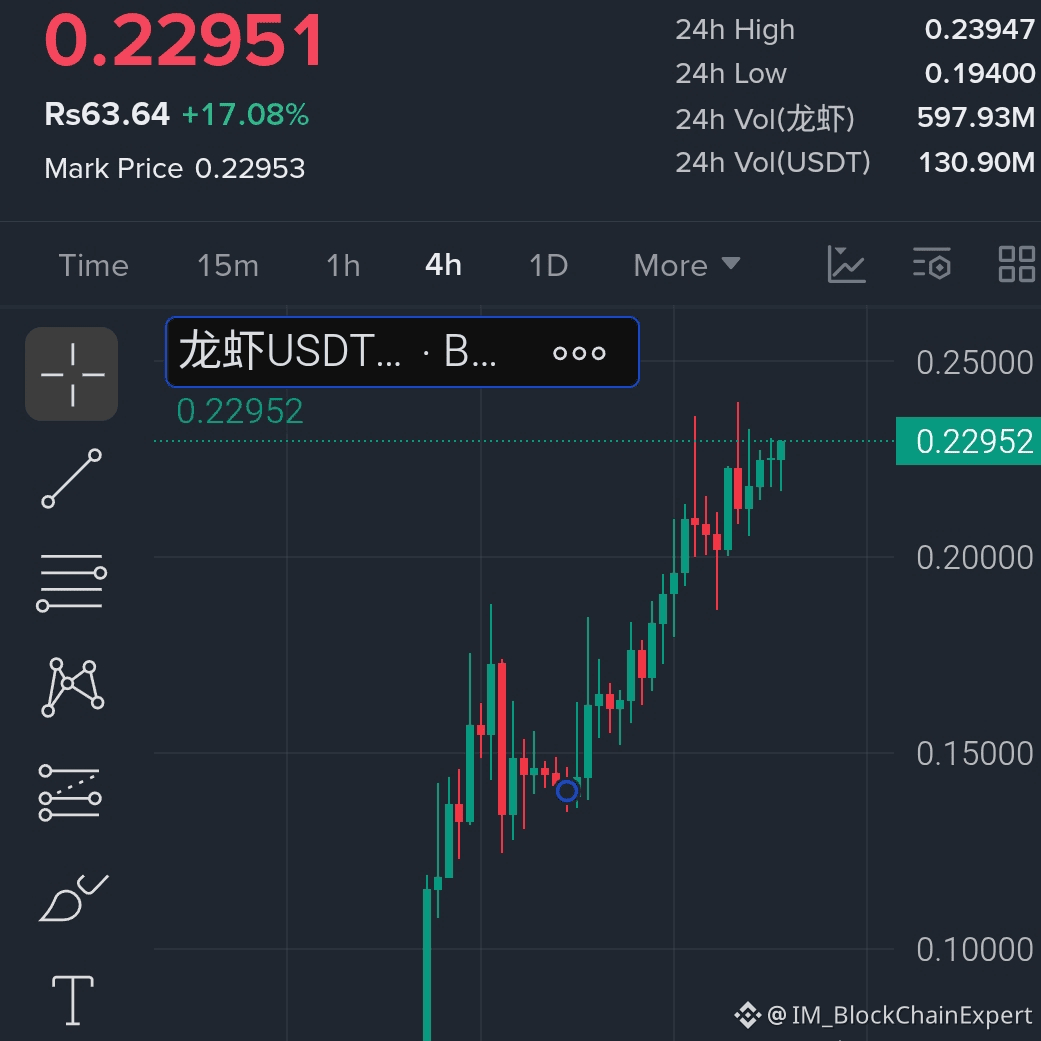
$SPCX is running quietly… but the chart is starting to get more and more interesting 👀📈
After a rise from around 152.5, the bulls have still held the higher-lows structure.🔥
Now the most critical question is: can $SPCX finally break through 155–157?🚀
🟩 $SPCX
Long plan 🟩
🎯 Entry: 153.90–154.40
🎯 TP1: 155.20
🎯 TP2: 156.00
🎯 TP3: 156.90
🛑 Stop loss: 153.20
📊 Technical analysis:
The 15-minute chart shows a gradually strengthening bullish structure, with the lows continually moving higher. After experiencing sharp volatility around 156–157, the price has returned to the 154 area and is currently consolidating—not continuing to fall.
📌 Trading plan:
More inclined to wait for a pullback to the 153.90–154.40 zone and for a bullish confirmation to appear. If it breaks below 153.20, then this trading plan is invalid.
🚀 DYOR | Manage risk well | Avoid using all your capital 💰⚠️
After a rise from around 152.5, the bulls have still held the higher-lows structure.🔥
Now the most critical question is: can $SPCX finally break through 155–157?🚀
🟩 $SPCX
Long plan 🟩
🎯 Entry: 153.90–154.40
🎯 TP1: 155.20
🎯 TP2: 156.00
🎯 TP3: 156.90
🛑 Stop loss: 153.20
📊 Technical analysis:
The 15-minute chart shows a gradually strengthening bullish structure, with the lows continually moving higher. After experiencing sharp volatility around 156–157, the price has returned to the 154 area and is currently consolidating—not continuing to fall.
📌 Trading plan:
More inclined to wait for a pullback to the 153.90–154.40 zone and for a bullish confirmation to appear. If it breaks below 153.20, then this trading plan is invalid.
🚀 DYOR | Manage risk well | Avoid using all your capital 💰⚠️