$ETH cryptocurrency academician: 9.18 Ethereum (ETH) pullback layout explained in detail—entries and defense during a choppy market? Latest market analysis reference
As of the current price 2425 for Ethereum, our long order at 2380 has already been filled. Next, focus on the 2463 level. If repeated attempts fail to hold above it, you can reduce your position in advance to lock in part of the profit. In a choppy market, don’t trade too excessively—frequent trades will only keep draining your principal. Trading is a long-term business; the profit or loss of a single trade isn’t the most important thing. What matters is following risk-control rules. Don’t move your stop loss arbitrarily, and don’t add to positions emotionally. Wait calmly for the market to choose a direction. Stay patient before the price breaks out of the range, and execute according to your plan.
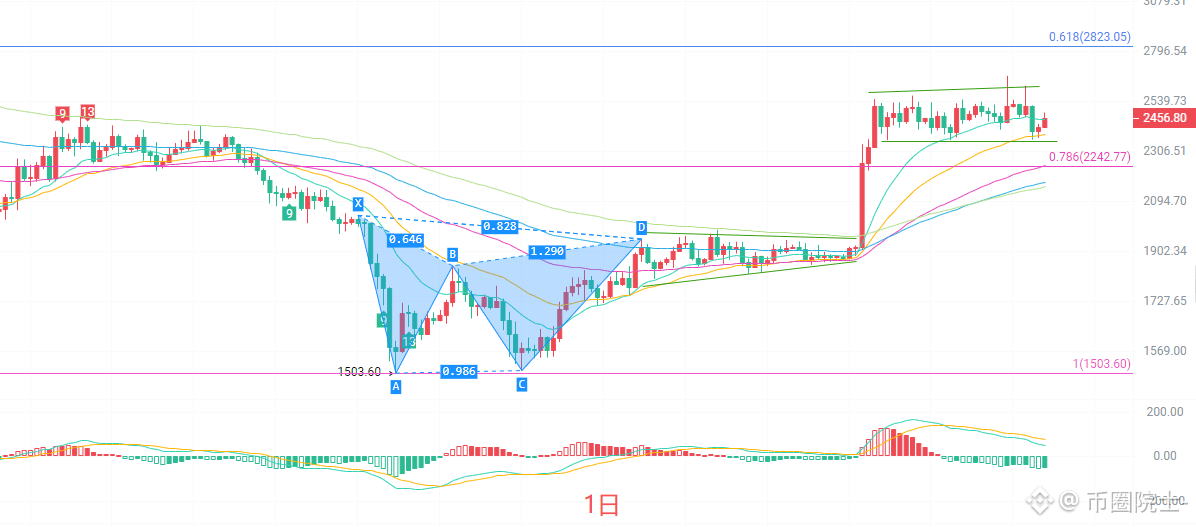
The daily K-line EMA moving-average group remains in a bullish alignment, meaning the medium- and long-term trend hasn’t directly turned bad. The MACD histogram red bars continue to shrink, and bullish momentum is gradually weakening. The Bollinger Bands are narrowing, and the price is running above the Bollinger midline. The key resistance is around 2539, while strong support lies at 2242. On a daily timeframe, this is more like consolidation after an up move—not a trend reversal. It’s a pullback and accumulation of energy within a bullish market. In the short term, it’s most likely to keep ranging and oscillating while waiting for a directional choice. The bigger structure still holds the possibility of continuing upward to challenge the previous high.
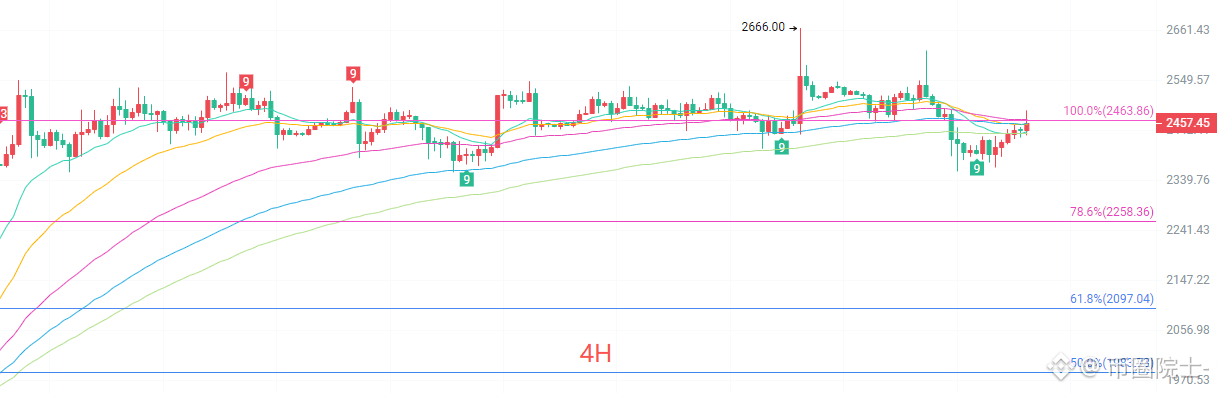
On the 4-hour K-line, after the pullback, price has regained and stood above the EMA15, and short-term bullish strength has been somewhat repaired. The MACD near the zero line is forming a gold-cross pattern, the green histogram is shrinking, and momentum is tending toward balance. The Bollinger Bands continue to tighten, indicating range compression and suggesting that a directional move will likely break out soon. The 100% Fibonacci level at 2463 is nearby resistance, while the 78.6% level at 2258 is an important support. The 4-hour chart shows clear oscillation characteristics—bulls and bears are trading back and forth. Don’t blindly chase or cut positions in the short term; instead, wait for price to approach the edges of the range before considering a trade.
Short-term references:
If price breaks above and moves north through 2360 to 2320, set a stop loss of 40 points, and targets are 2420 to 2470.
If price faces pressure and moves south from 2530 to 2550, set a stop loss of 40 points, and targets are 2460 to 2420.
Specific actions should be based on real-time order-book data. For more information, refer to the author’s updates. This article is published with a delay; it’s recommended as reference only—risk is your own.
#ETH走势分析
As of the current price 2425 for Ethereum, our long order at 2380 has already been filled. Next, focus on the 2463 level. If repeated attempts fail to hold above it, you can reduce your position in advance to lock in part of the profit. In a choppy market, don’t trade too excessively—frequent trades will only keep draining your principal. Trading is a long-term business; the profit or loss of a single trade isn’t the most important thing. What matters is following risk-control rules. Don’t move your stop loss arbitrarily, and don’t add to positions emotionally. Wait calmly for the market to choose a direction. Stay patient before the price breaks out of the range, and execute according to your plan.
The daily K-line EMA moving-average group remains in a bullish alignment, meaning the medium- and long-term trend hasn’t directly turned bad. The MACD histogram red bars continue to shrink, and bullish momentum is gradually weakening. The Bollinger Bands are narrowing, and the price is running above the Bollinger midline. The key resistance is around 2539, while strong support lies at 2242. On a daily timeframe, this is more like consolidation after an up move—not a trend reversal. It’s a pullback and accumulation of energy within a bullish market. In the short term, it’s most likely to keep ranging and oscillating while waiting for a directional choice. The bigger structure still holds the possibility of continuing upward to challenge the previous high.
On the 4-hour K-line, after the pullback, price has regained and stood above the EMA15, and short-term bullish strength has been somewhat repaired. The MACD near the zero line is forming a gold-cross pattern, the green histogram is shrinking, and momentum is tending toward balance. The Bollinger Bands continue to tighten, indicating range compression and suggesting that a directional move will likely break out soon. The 100% Fibonacci level at 2463 is nearby resistance, while the 78.6% level at 2258 is an important support. The 4-hour chart shows clear oscillation characteristics—bulls and bears are trading back and forth. Don’t blindly chase or cut positions in the short term; instead, wait for price to approach the edges of the range before considering a trade.
Short-term references:
If price breaks above and moves north through 2360 to 2320, set a stop loss of 40 points, and targets are 2420 to 2470.
If price faces pressure and moves south from 2530 to 2550, set a stop loss of 40 points, and targets are 2460 to 2420.
Specific actions should be based on real-time order-book data. For more information, refer to the author’s updates. This article is published with a delay; it’s recommended as reference only—risk is your own.
#ETH走势分析