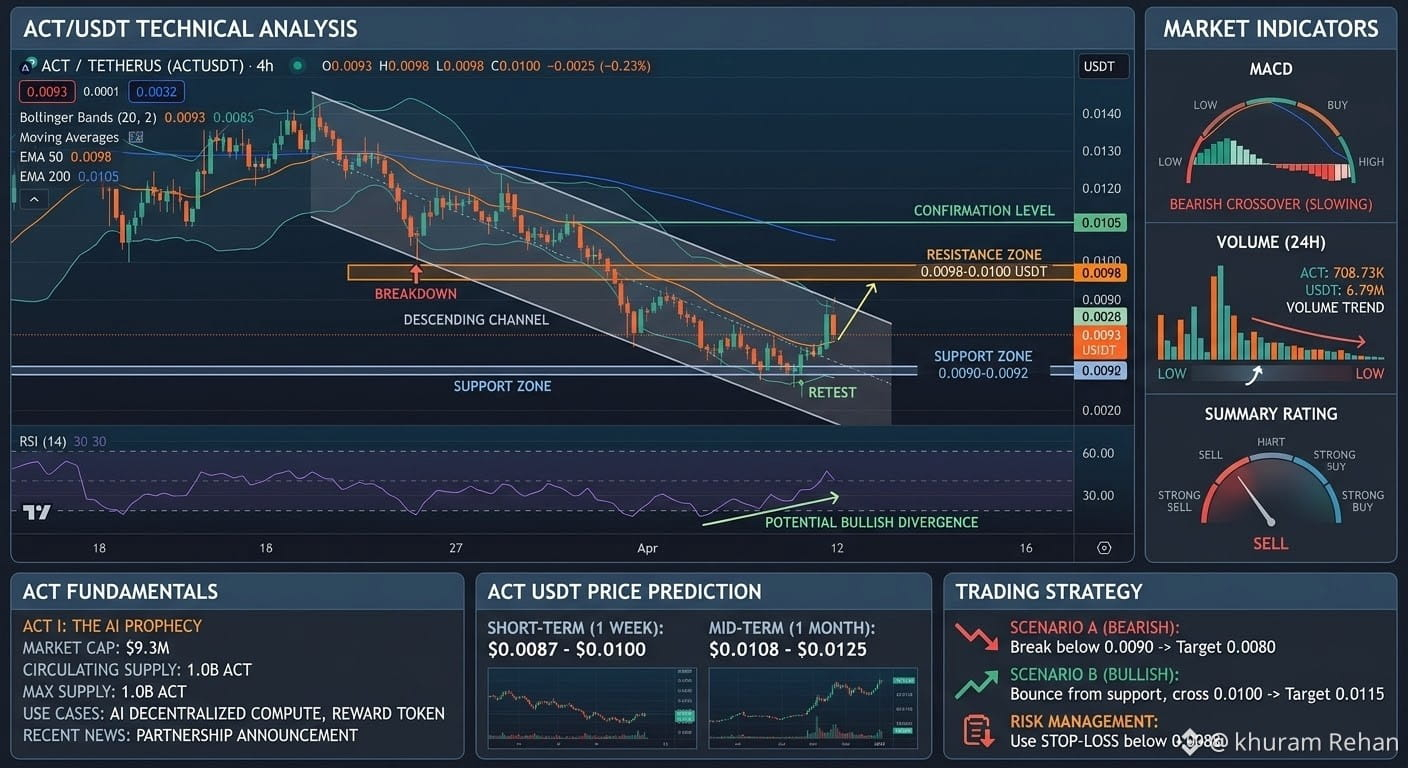
$ACT ACT/USDT pair, based on current technical chart patterns and fundamental indicators, is detailed below:
Technical Breakdown
Price Action & Trend: ACT is consolidating within a Descending Channel. It recently made a retest near the lower Support Zone ($0.0090–$0.0092 USDT). A breakout above the channel resistance zone ($0.0098–$0.0100 USDT) would signal a potential trend reversal.
RSI (Relative Strength Index): Displays a subtle Bullish Divergence on higher timeframes near oversold levels, suggesting selling momentum is slowing down.
Moving Averages (50 & 200 EMA): The 50 EMA ($0.0098) serves as immediate resistance. Reclaiming the confirmation level above the 200 EMA ($0.0105) is crucial for sustained upward momentum.
#OstiumLoanDisputeHearingSetInNYFederalCourt #HyperliquidUSDCSupplyOvertakesSolana
Technical Breakdown
Price Action & Trend: ACT is consolidating within a Descending Channel. It recently made a retest near the lower Support Zone ($0.0090–$0.0092 USDT). A breakout above the channel resistance zone ($0.0098–$0.0100 USDT) would signal a potential trend reversal.
RSI (Relative Strength Index): Displays a subtle Bullish Divergence on higher timeframes near oversold levels, suggesting selling momentum is slowing down.
Moving Averages (50 & 200 EMA): The 50 EMA ($0.0098) serves as immediate resistance. Reclaiming the confirmation level above the 200 EMA ($0.0105) is crucial for sustained upward momentum.
#OstiumLoanDisputeHearingSetInNYFederalCourt #HyperliquidUSDCSupplyOvertakesSolana