
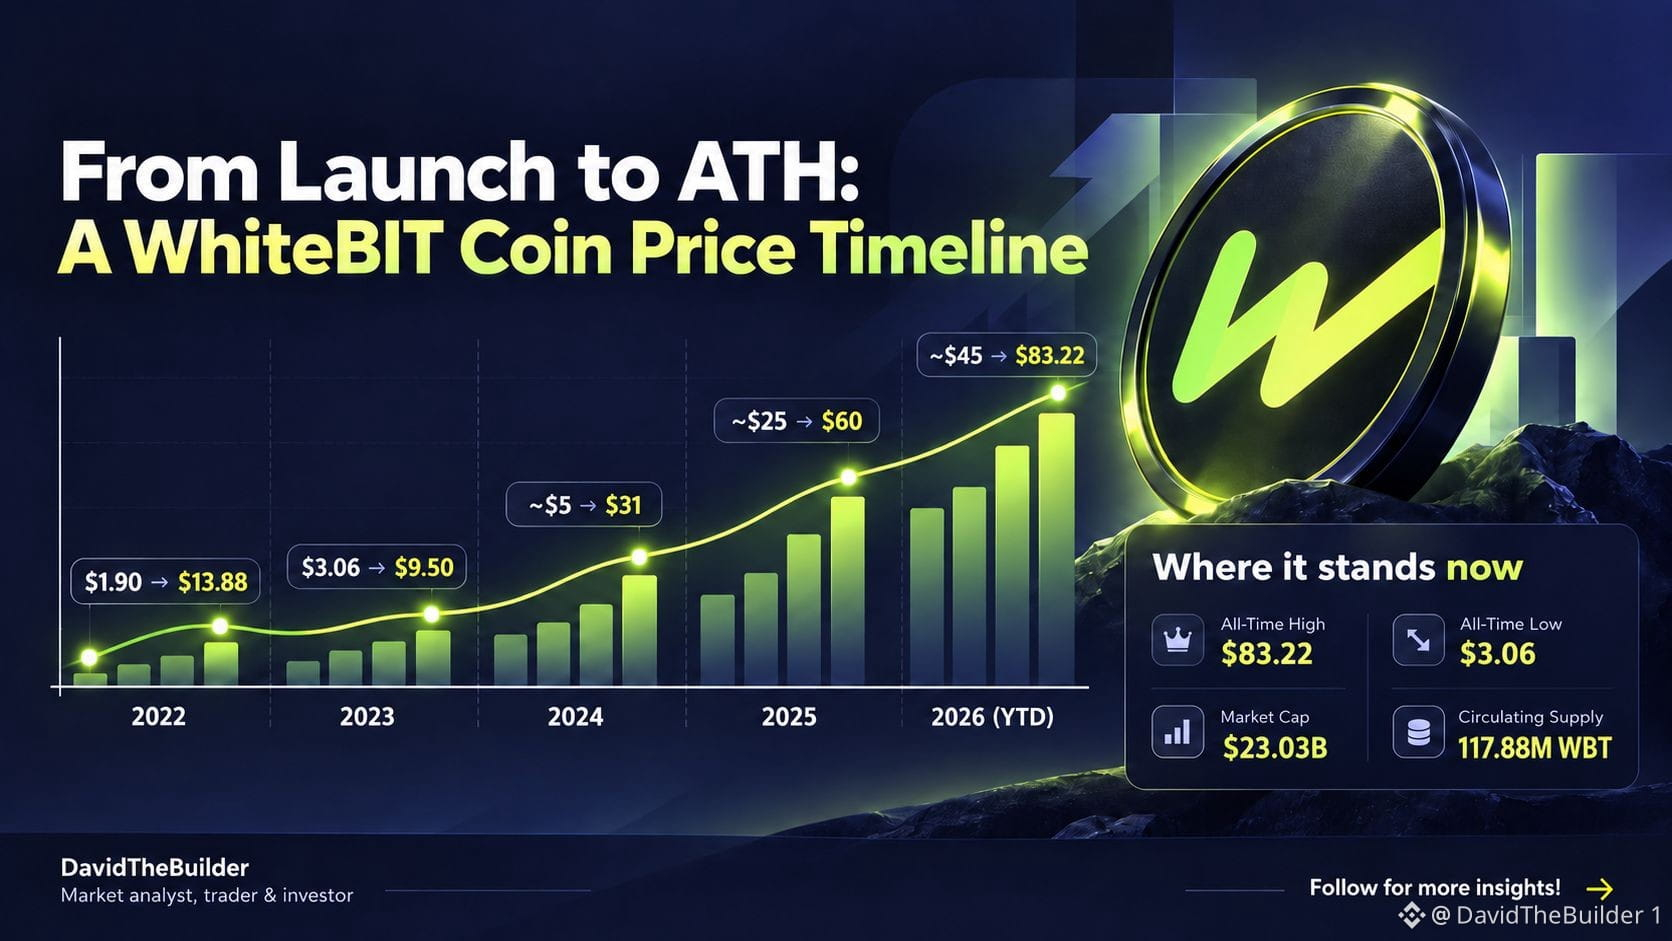
📊 WBT's Four-Year Chart: Cycles, Not a Straight Climb CoinGecko currently tracks close to 18,000 coins, including $BTC . Out of that entire market, only around 370 fall into the "exchange-based token" category - real coins tied to an actual exchange. Like any asset, these coins move through cycles: hype phases, corrections, and long stretches of consolidation before the next leg up. Rarely a straight line. I decided to map one of them - WhiteBIT Coin (WBT) - from launch to today: 📅 2022 ➡ $1.90 - $13.88 📅 2023 ➡ $3.06 - $9.50 📅 2024 ➡ ~$5 - $31 📅 2025 ➡ ~$25 - $60 📅 2026 (YTD) ➡ ~$45 - $83.22 Where it stands right now: 🔺 All-Time High: $83.22 🔻 All-Time Low: $3.06 💰 Market Cap: $23.03B 🔄 Circulating Supply: 117.88M WBT 📊 The trend that stands out is the floor. Every year's low has landed higher than the previous year's low. Instead of one straight climb, WBT has been stepping up in stages: expansion, pullback, a higher base, repeat. That staircase pattern - rising lows rather than a vertical chart - shows up across several exchange coins, not just this one. Worth watching for anyone tracking the category as a whole. Disclaimer: This is not financial or investment advice. DYOR before making any decisions. Use at your own risk. #BTC Price Analysis# #Bitcoin Price Prediction: What is Bitcoins next move?#

Post
Disclaimer: Includes third-party opinions. No advice. Binance AI may be used without guarantee. See T&Cs.