$IOST Technical Analysis IOST/USDT (5m): Bounce Opportunity or Bearish Continuation? 🔥
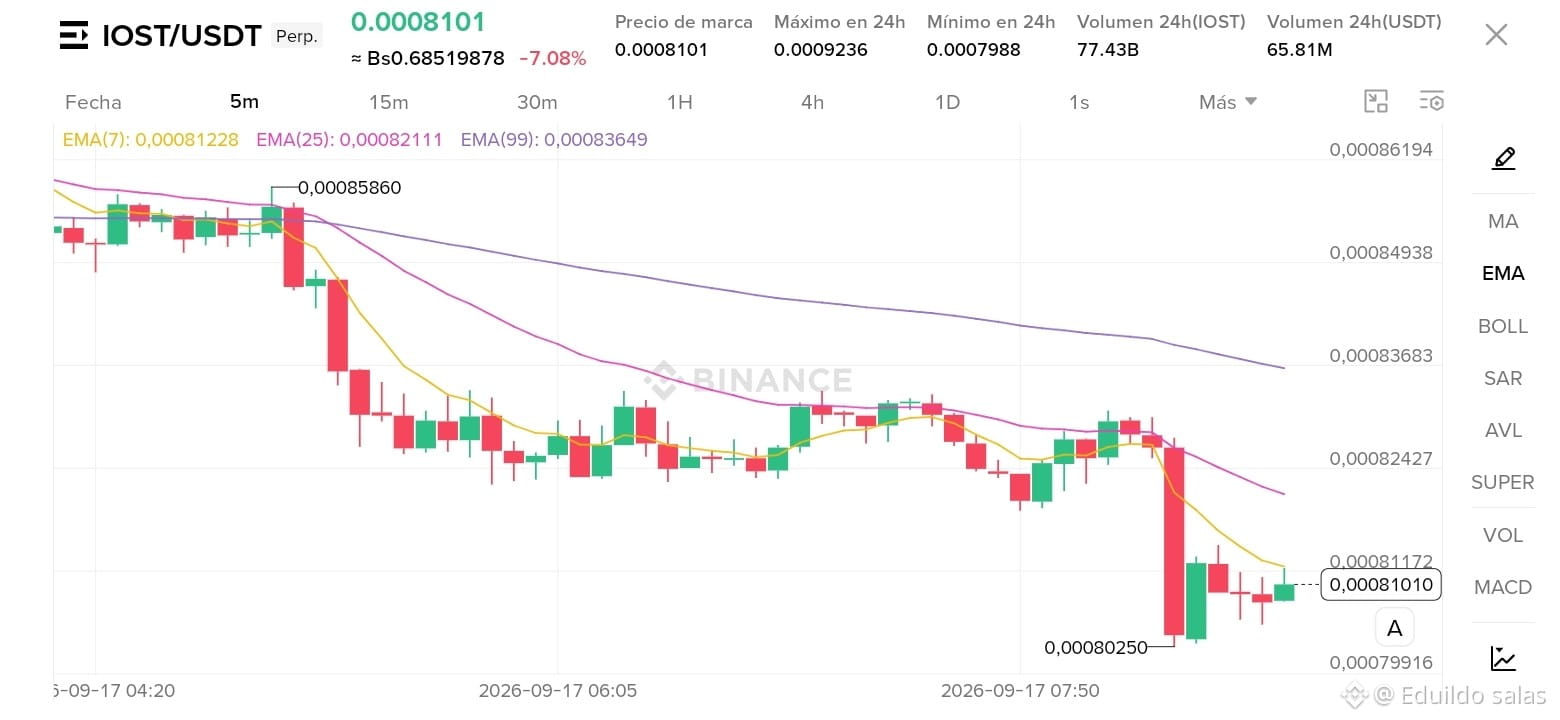
The $IOST pair shows a cumulative drop of -7.08%, indicating a session dominated by sellers. After a strong downward impulse, the price has reached a local low around 0.0008025, seeking stability.
📉 Current Technical Structure:
Moving Average Alignment (EMA): EMA 7 (0.0008122) remains below EMA 25 (0.0008211) and EMA 99 (0.0008364), confirming a bearish trend alignment in the short term.
Price Action: After the high-volume bearish candle toward 0.0008025, the price is trading in a small sideways consolidation phase, trying to build an absorption base.
🎯 Scenarios to Monitor:
Bearish Scenario (Continuation):
If the current consolidation fails to break above EMA 7 and loses the key support at 0.0008000 / 0.0007988, the path opens for new lows toward the 0.0007850 area.
Bullish Scenario (Technical / Corrective Bounce):
To confirm a change in intraday dynamics, the price needs to reclaim and close 5m candles above EMA 25 (0.0008211). A breakout with volume would open the door to a retest of EMA 99 (0.0008364).
💡 Risk Management: In 5-minute timeframes, volatility is high. It’s recommended to always trade using a Stop Loss and wait for volume confirmations in supply and demand zones before taking positions.
What do you think, traders? Will we see a quick short squeeze or will the downtrend keep control? 👇
#IOST #BinanceSquare #CryptoAnalysis #Trading #USDT #TechnicalAnalysis
The $IOST pair shows a cumulative drop of -7.08%, indicating a session dominated by sellers. After a strong downward impulse, the price has reached a local low around 0.0008025, seeking stability.
📉 Current Technical Structure:
Moving Average Alignment (EMA): EMA 7 (0.0008122) remains below EMA 25 (0.0008211) and EMA 99 (0.0008364), confirming a bearish trend alignment in the short term.
Price Action: After the high-volume bearish candle toward 0.0008025, the price is trading in a small sideways consolidation phase, trying to build an absorption base.
🎯 Scenarios to Monitor:
Bearish Scenario (Continuation):
If the current consolidation fails to break above EMA 7 and loses the key support at 0.0008000 / 0.0007988, the path opens for new lows toward the 0.0007850 area.
Bullish Scenario (Technical / Corrective Bounce):
To confirm a change in intraday dynamics, the price needs to reclaim and close 5m candles above EMA 25 (0.0008211). A breakout with volume would open the door to a retest of EMA 99 (0.0008364).
💡 Risk Management: In 5-minute timeframes, volatility is high. It’s recommended to always trade using a Stop Loss and wait for volume confirmations in supply and demand zones before taking positions.
What do you think, traders? Will we see a quick short squeeze or will the downtrend keep control? 👇
#IOST #BinanceSquare #CryptoAnalysis #Trading #USDT #TechnicalAnalysis