$BTC 💡 Many beginner traders misunderstand the RSI.
In simple terms:
RSI = an indicator to measure the momentum of price movement, not a tool to guarantee that price will definitely rise or fall.
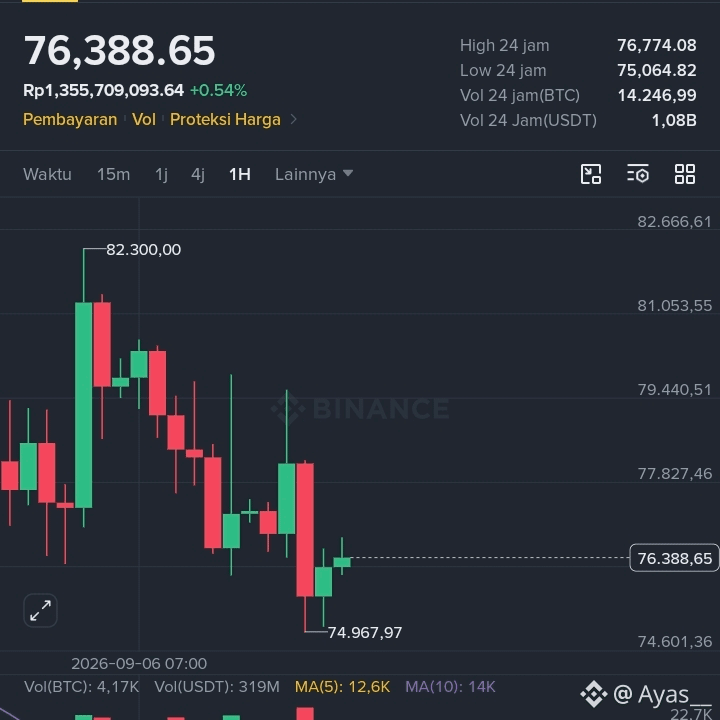
On this BTC/USDT 1H chart, RSI(6) is around 41.89. This means short-term momentum is still tending to be weak and has not entered the oversold area.
Example from the chart: 📉 BTC dropped from the 82,300 area and briefly touched 74,967.
📈 After that, a rebound appeared to around 76,388, but the price is still below the resistance area around 77,827.
What to remember:
RSI <30 is often called the oversold area, but that does not mean the price will automatically go up.
RSI >70 is often called overbought, but that does not mean the price will automatically go down.
It’s better to use RSI together with price structure, volume, and support & resistance.
So don’t just look at the RSI numbers. Also pay attention to the trend direction, volume, and important price levels.
📌 BTC right now:
Support: 74.967
Nearest resistance: 77.827
Next resistance: 79.440
According to you, will BTC manage to get back above 77.827 or retest 74.967? 👇
#BTC #bitcoin #BinanceSquareBTC quare #Cryp to #Trading #RSI
In simple terms:
RSI = an indicator to measure the momentum of price movement, not a tool to guarantee that price will definitely rise or fall.
On this BTC/USDT 1H chart, RSI(6) is around 41.89. This means short-term momentum is still tending to be weak and has not entered the oversold area.
Example from the chart: 📉 BTC dropped from the 82,300 area and briefly touched 74,967.
📈 After that, a rebound appeared to around 76,388, but the price is still below the resistance area around 77,827.
What to remember:
RSI <30 is often called the oversold area, but that does not mean the price will automatically go up.
RSI >70 is often called overbought, but that does not mean the price will automatically go down.
It’s better to use RSI together with price structure, volume, and support & resistance.
So don’t just look at the RSI numbers. Also pay attention to the trend direction, volume, and important price levels.
📌 BTC right now:
Support: 74.967
Nearest resistance: 77.827
Next resistance: 79.440
According to you, will BTC manage to get back above 77.827 or retest 74.967? 👇
#BTC #bitcoin #BinanceSquareBTC quare #Cryp to #Trading #RSI