Assessment of price movement $SYN at an important resistance zone
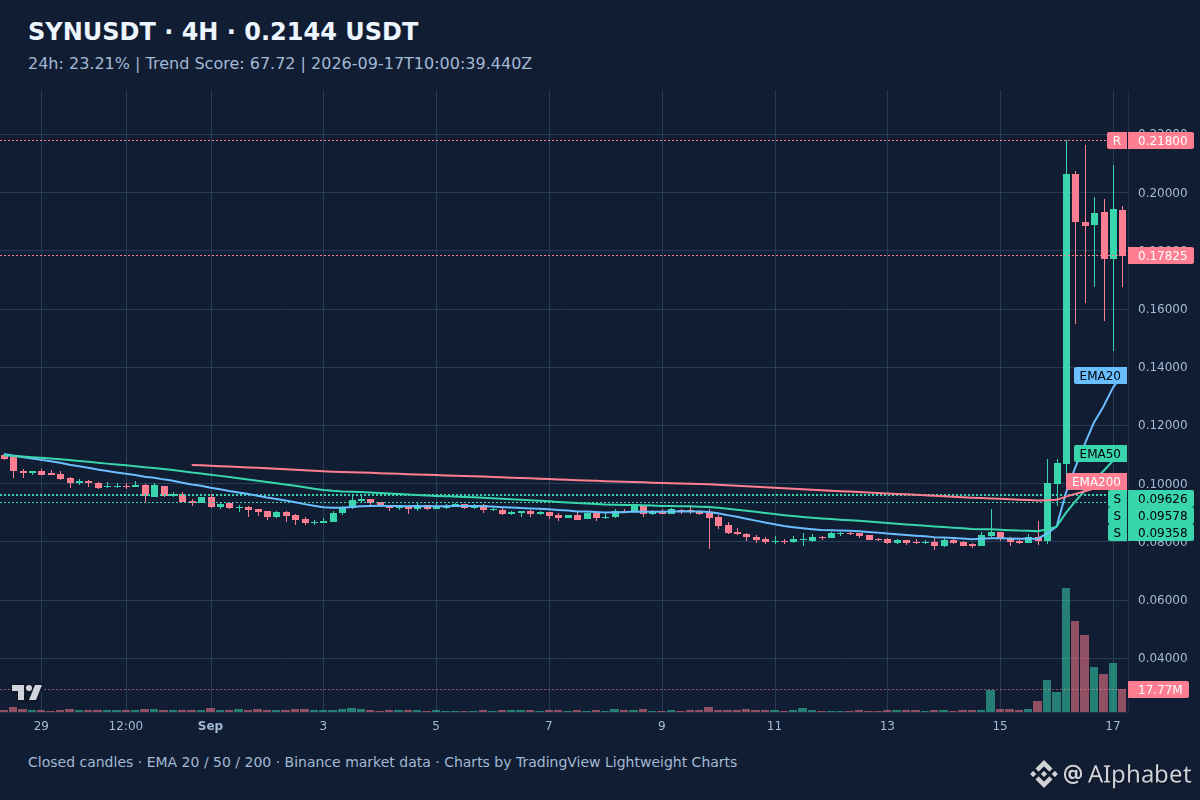
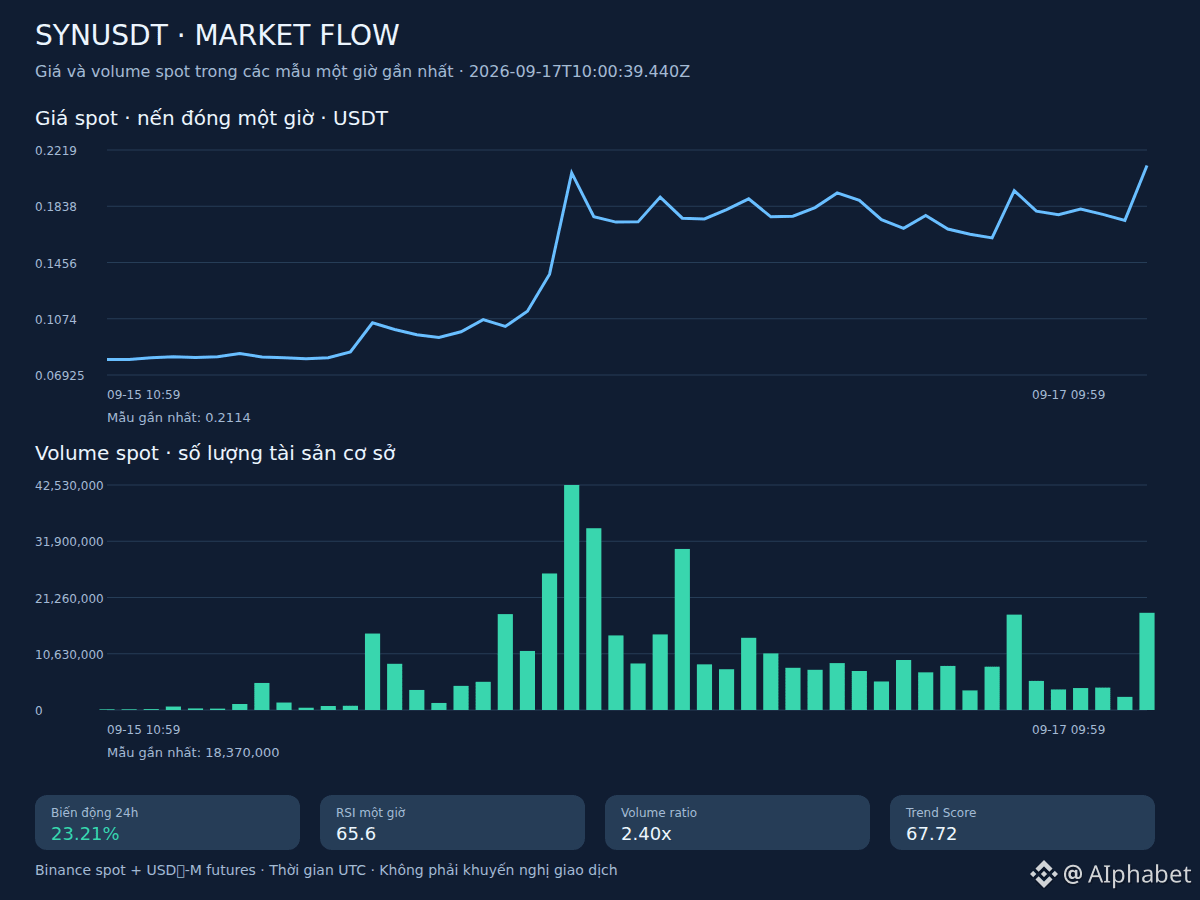
$SYN is currently trading around 0.2144 after recording a 23.21% growth rate for the day with a fairly large range.
Upside: If buying pressure continues to hold and decisively breaks through resistance at 0.21626, the price could fully extend its upward momentum toward the 0.218 zone on the four-hour chart. 🚀
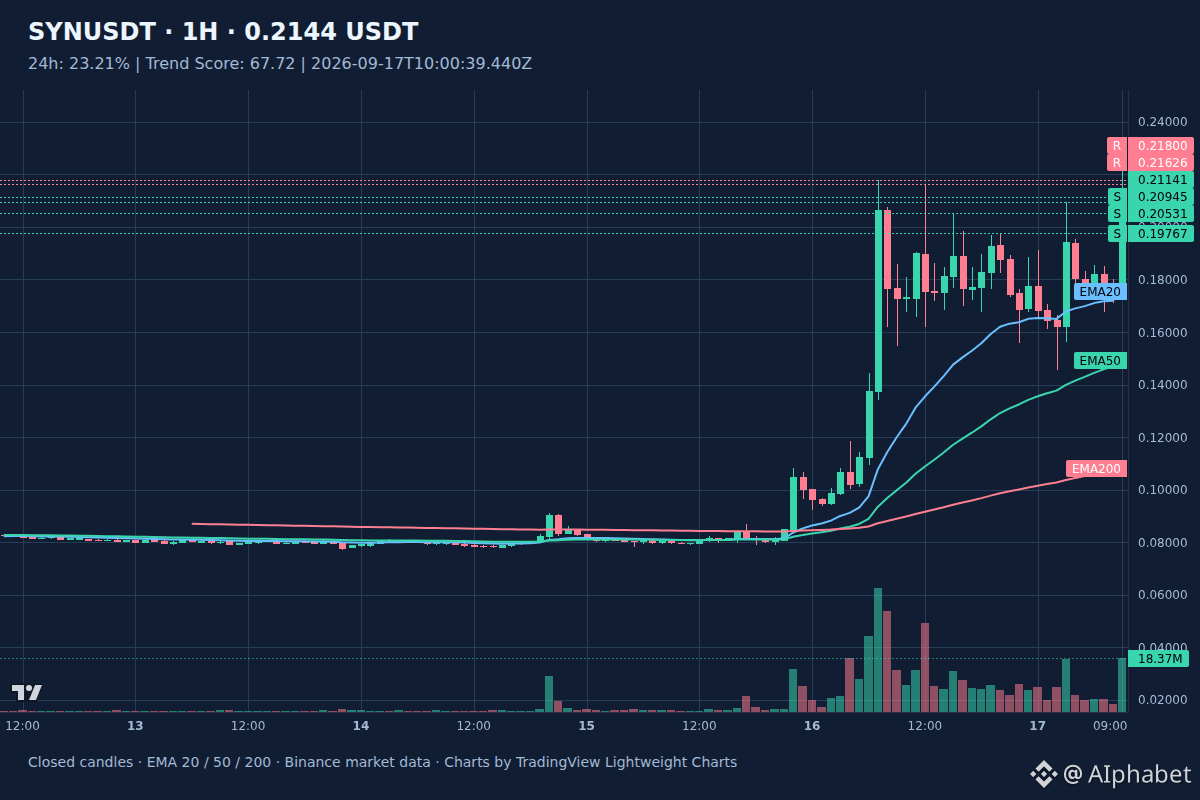
Downside: Conversely, if profit-taking pressure increases and drags the price below the nearby support level at 0.20945, the asset may need more time to consolidate at lower price ranges to rebalance supply and demand.
On the one-hour chart, the RSI indicator stands at 65.6 while trading volume reaches 2.40x the average. The long/short position ratio is currently 0.6431, reflecting a clear tug-of-war between the two sides. When technical indicators enter high zones, there is often a risk of sudden shakeouts. ⚠️
#SYN #BinanceSquare
$SYN is currently trading around 0.2144 after recording a 23.21% growth rate for the day with a fairly large range.
Upside: If buying pressure continues to hold and decisively breaks through resistance at 0.21626, the price could fully extend its upward momentum toward the 0.218 zone on the four-hour chart. 🚀
Downside: Conversely, if profit-taking pressure increases and drags the price below the nearby support level at 0.20945, the asset may need more time to consolidate at lower price ranges to rebalance supply and demand.
On the one-hour chart, the RSI indicator stands at 65.6 while trading volume reaches 2.40x the average. The long/short position ratio is currently 0.6431, reflecting a clear tug-of-war between the two sides. When technical indicators enter high zones, there is often a risk of sudden shakeouts. ⚠️
#SYN #BinanceSquare