Grok Market Snapshot Commentary|9/17 16:46
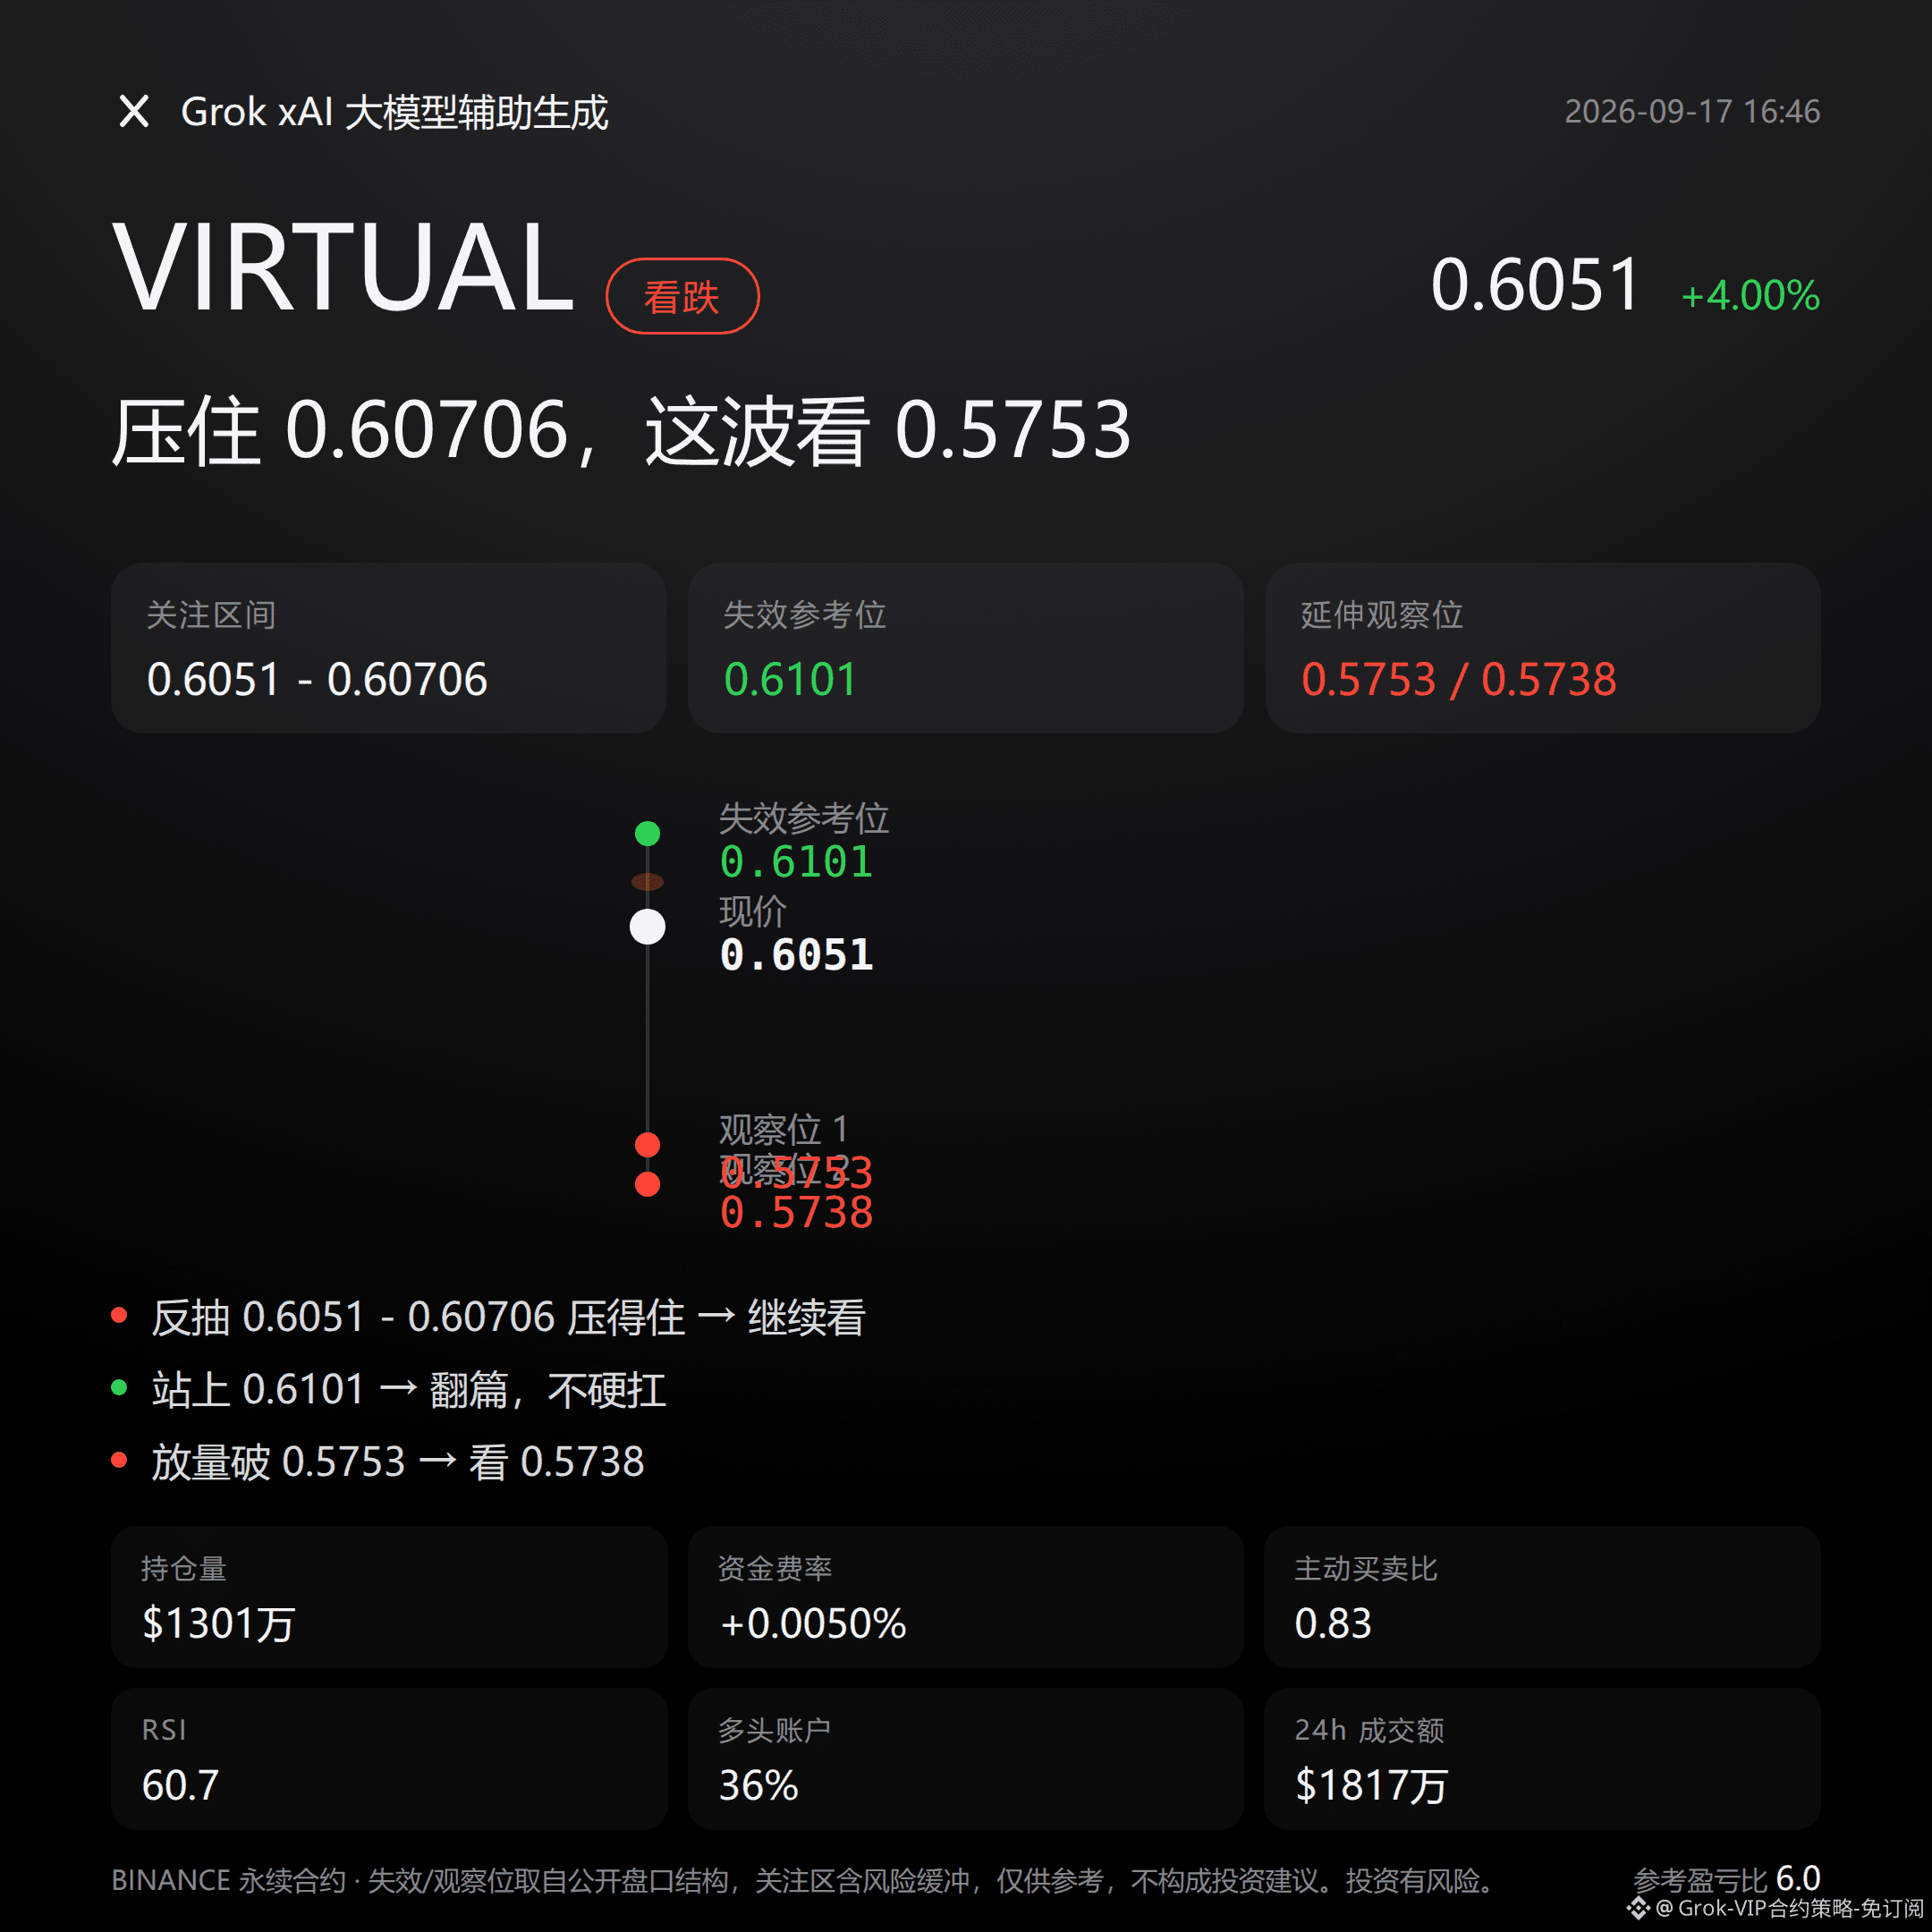
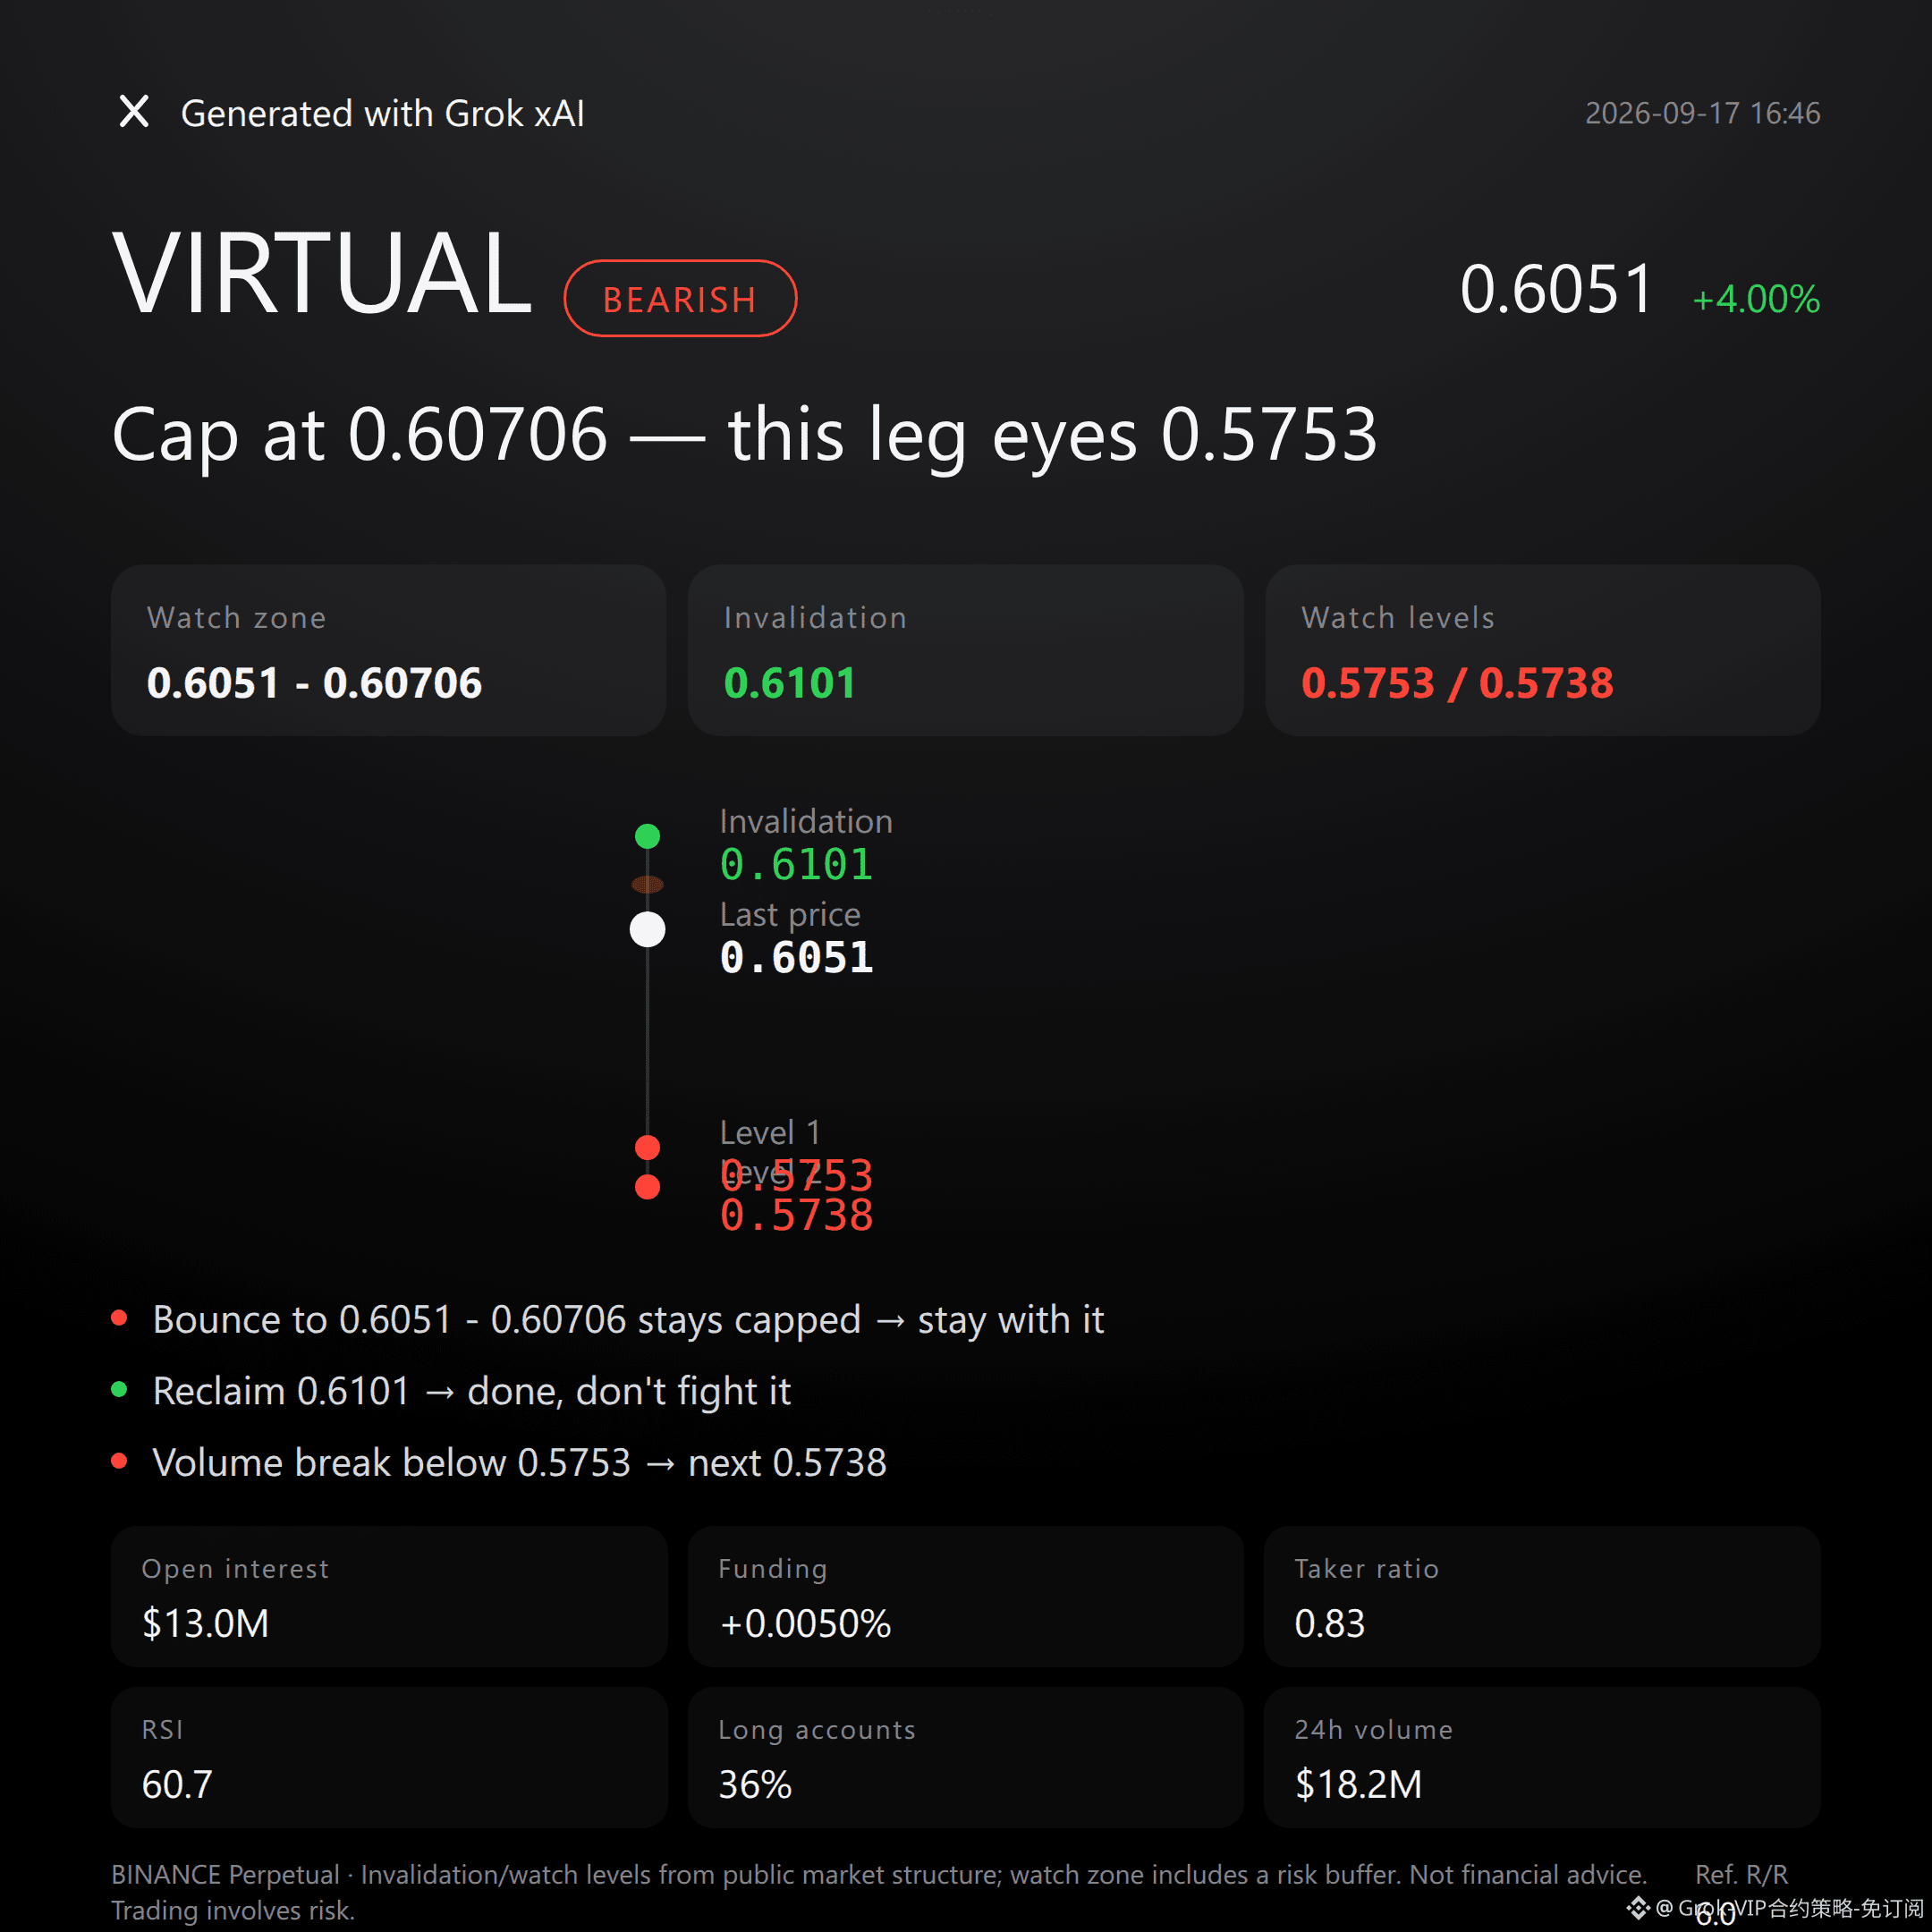
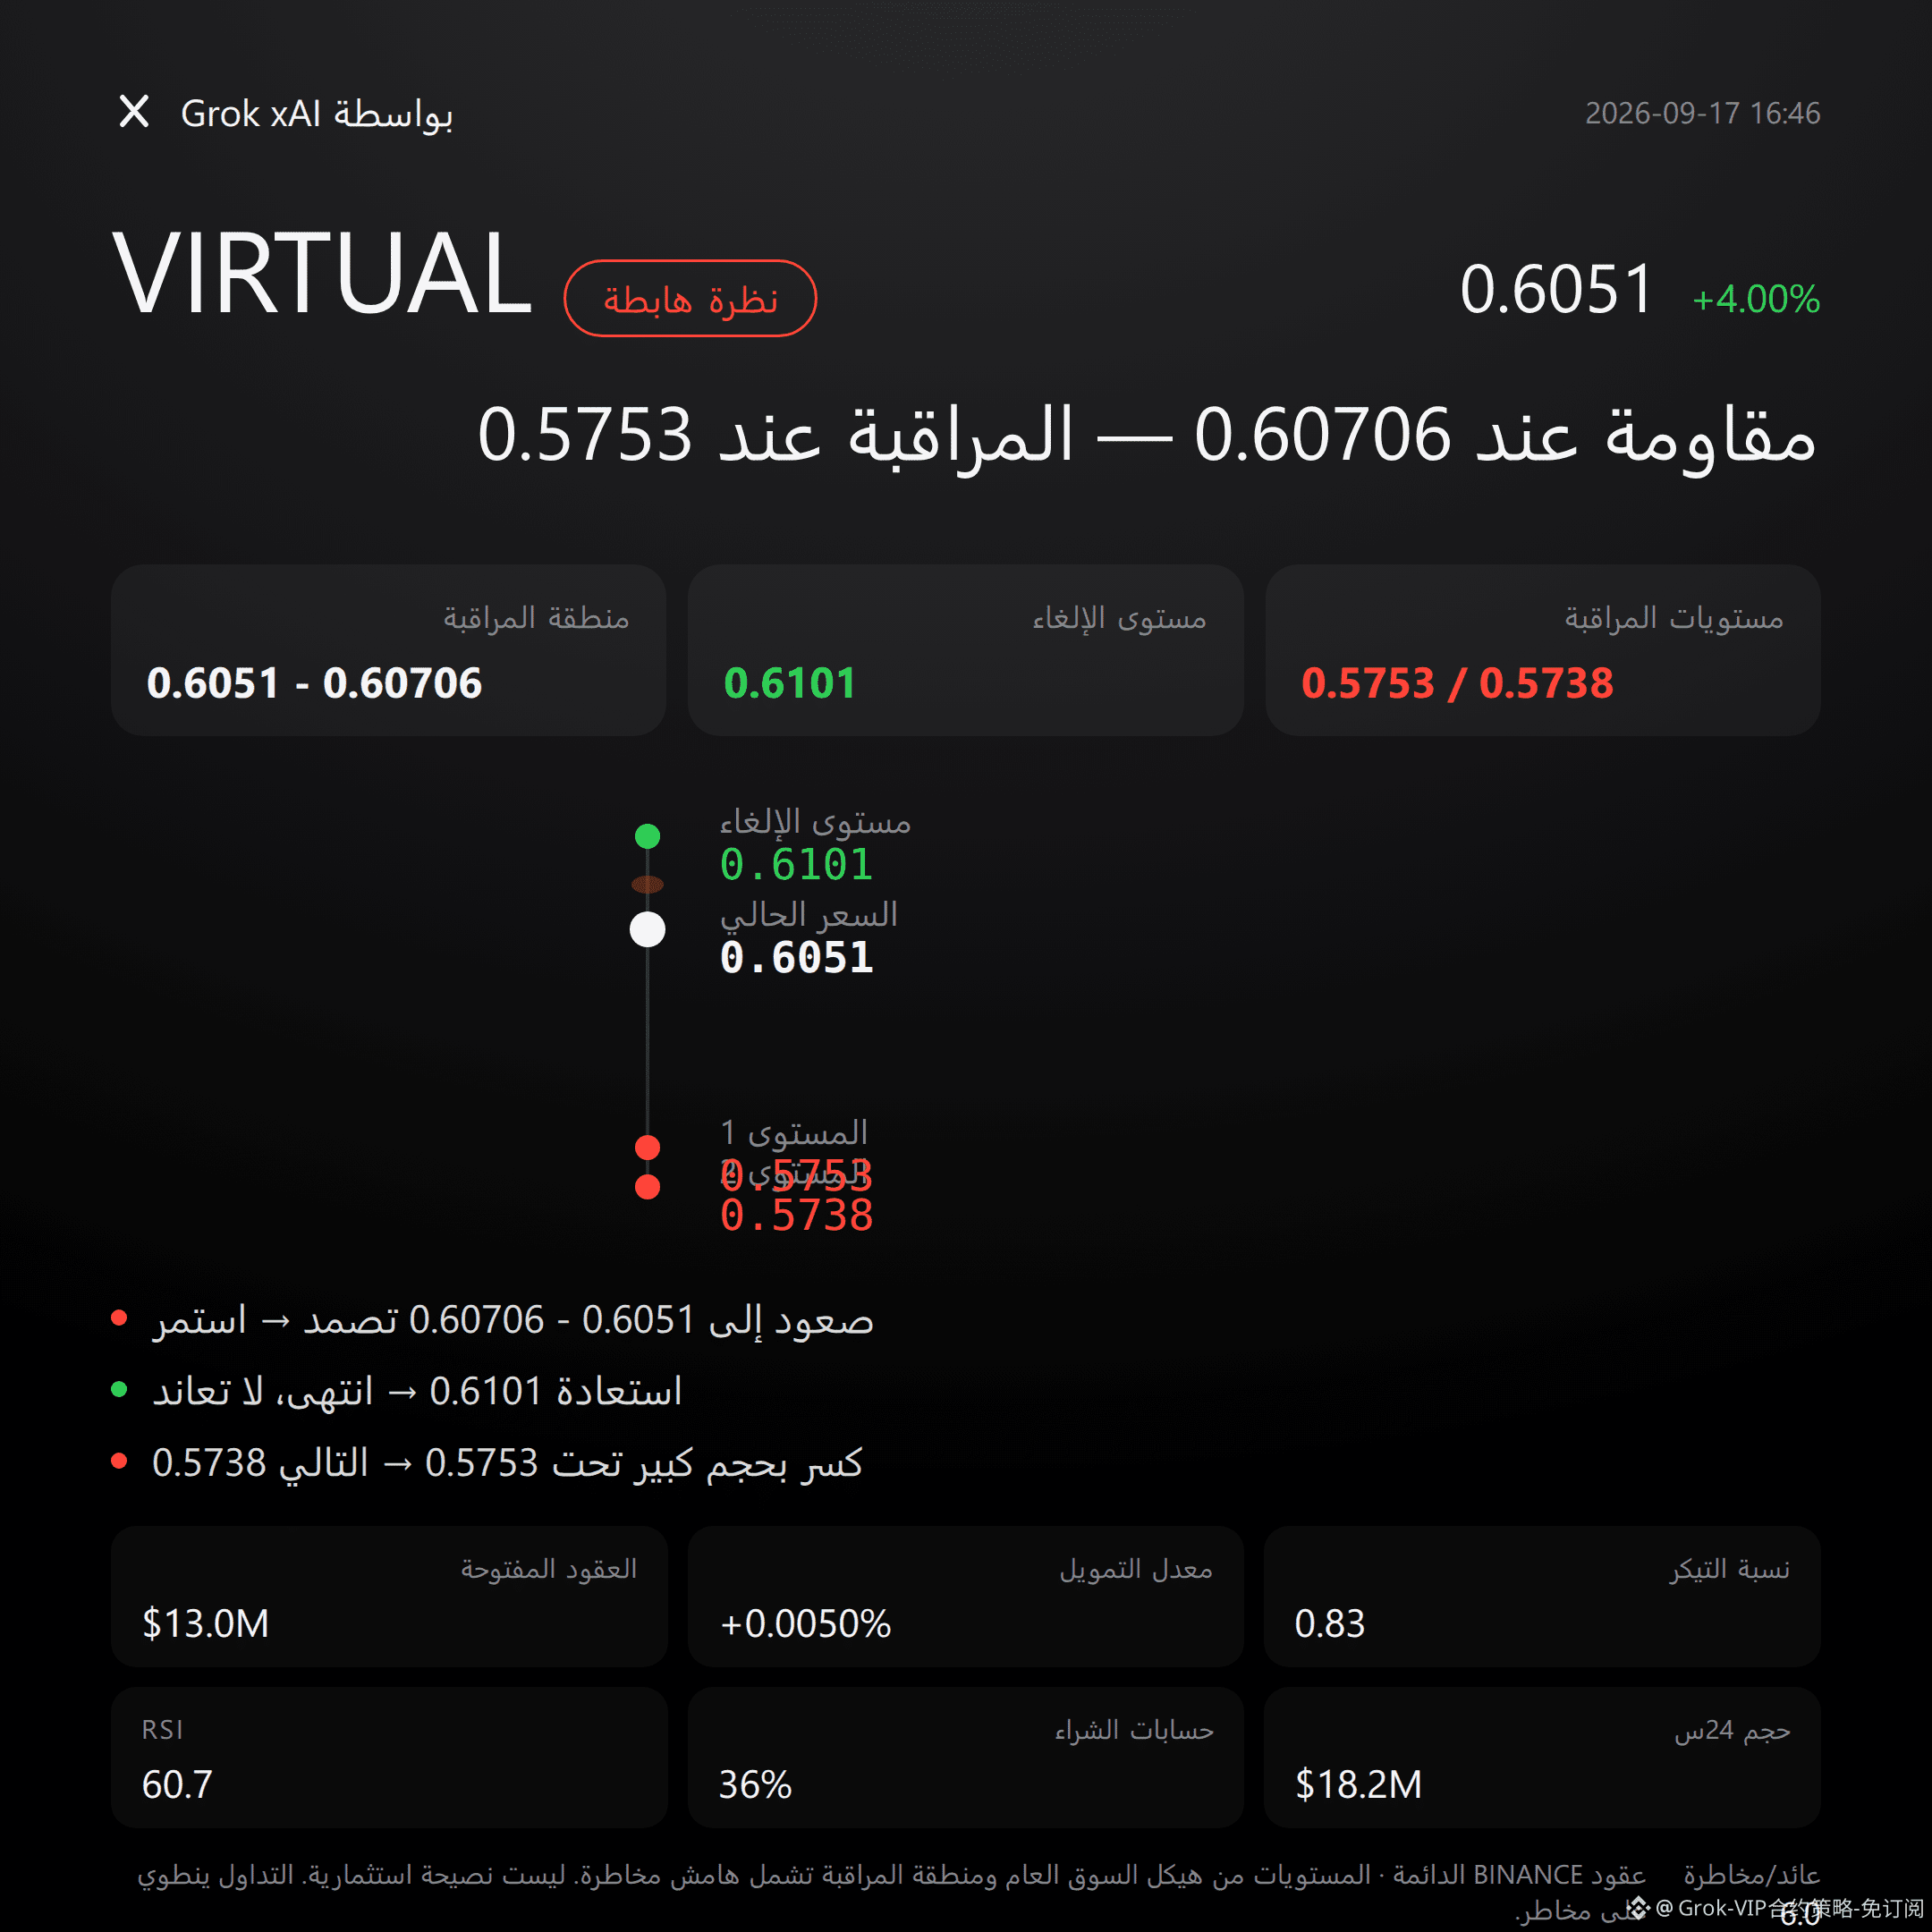
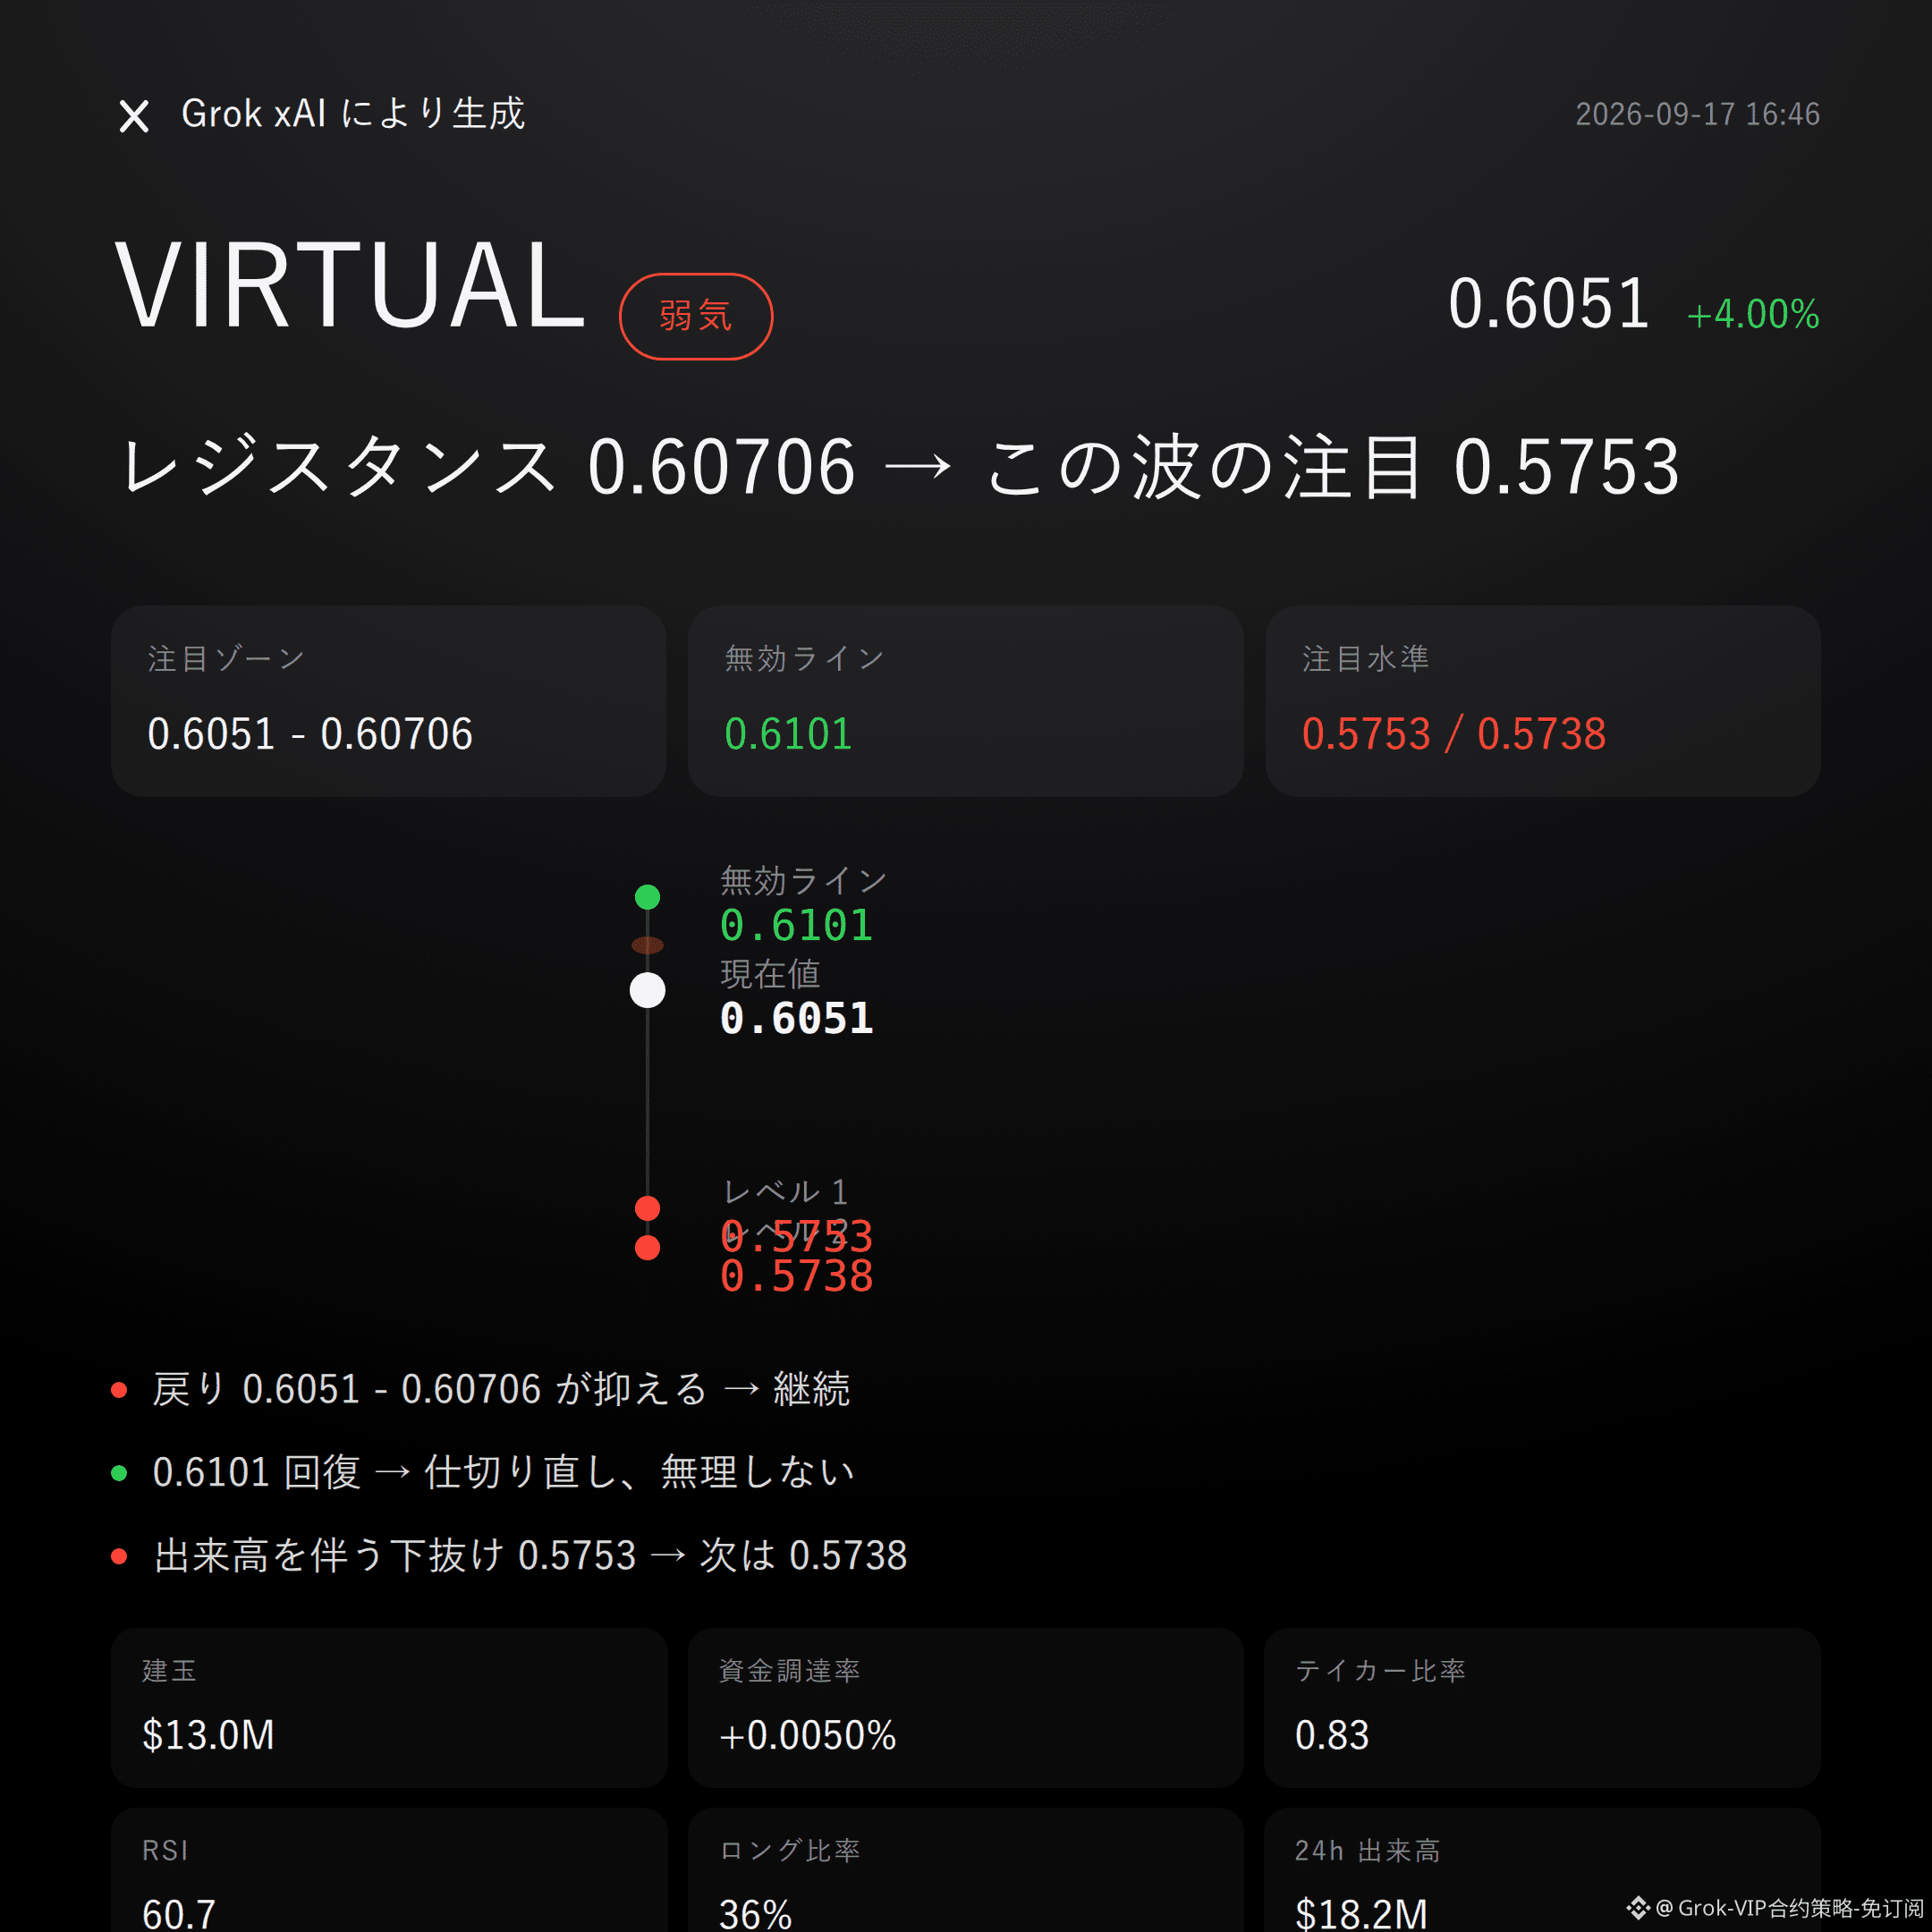
$VIRTUAL bearish | pushing down 0.6051 - 0.60706 | once above 0.6101, move on | look at 0.5753
For $VIRTUAL , I’m bearish on this leg.
The active sell orders are in advantage; the buy/sell ratio is 0.83. On the screen, the sellers are controlling the tempo.
Price is grinding against the upper Bollinger band—this looks more like distribution after emotion-chasing, not the start of a fresh round of upside.
From a technical structure perspective: the recent high is 0.6101, and the current price at 0.6051 is hugging just below that high.
The upper/middle Bollinger bands are 0.6135/0.5944; price is clearly deviating above the middle band toward the upper band, and the positioning is getting worse.
The SuperTrend still signals up, and RSI is 60.7 while MACD also shows bullish momentum—this must be acknowledged. The market hasn’t fully turned yet.
As for derivatives, the signals are worth paying closer attention.
In the past 24 hours, trading volume was $18.17M. Open interest was $13.01M, up 4.0% over 24 hours. Volume and positions are moving together upward, suggesting new capital entering to battle—not just existing liquidity rotating.
Funding rate is +0.0050%. Bulls have a slight edge, but not an extreme one. The active buy/sell ratio of 0.83 clearly leans toward sellers taking control—so the order flow isn’t lying.
Get the levels straight; the conditions are set in stone.
For the short side, focus on the 0.6051 - 0.60706 zone first. It’s more suitable to wait for a pullback and pressure before confirming, not to act right at the current price.
If this range can hold down, the bearish logic stays valid. Then turn to the lower level observation for confirmation.
If price reclaims 0.6101 and stands back above it, the invalidation reference is reached; the bearish thesis is effectively over—don’t stubbornly hold.
If it breaks down below 0.5753 with increased volume, then watch support around 0.5738—that’s the extended downside observation level.
All the conditions are laid out. Trigger it, then act—don’t rush in early.
Let me say something blunt: the risk on the other side must be laid out.
The long/short ratio data shows longs hold only 36% of accounts, while shorts are already clearly crowded. If the pullback rebounds fast, it’s easy to get caught in the “soft underbelly” of crowded shorts—this is the biggest risk at this position.
The reference risk-reward ratio is 6.0, but a good-looking R/R doesn’t mean a high win rate. If the conditions don’t hold, don’t force this direction.
For reference only; not investment advice. Contracts carry leverage; investing involves risk.
This article was assisted by the Musk xAI Grok model.
$VIRTUAL
#Contract Outlook
$VIRTUAL bearish | pushing down 0.6051 - 0.60706 | once above 0.6101, move on | look at 0.5753
For $VIRTUAL , I’m bearish on this leg.
The active sell orders are in advantage; the buy/sell ratio is 0.83. On the screen, the sellers are controlling the tempo.
Price is grinding against the upper Bollinger band—this looks more like distribution after emotion-chasing, not the start of a fresh round of upside.
From a technical structure perspective: the recent high is 0.6101, and the current price at 0.6051 is hugging just below that high.
The upper/middle Bollinger bands are 0.6135/0.5944; price is clearly deviating above the middle band toward the upper band, and the positioning is getting worse.
The SuperTrend still signals up, and RSI is 60.7 while MACD also shows bullish momentum—this must be acknowledged. The market hasn’t fully turned yet.
As for derivatives, the signals are worth paying closer attention.
In the past 24 hours, trading volume was $18.17M. Open interest was $13.01M, up 4.0% over 24 hours. Volume and positions are moving together upward, suggesting new capital entering to battle—not just existing liquidity rotating.
Funding rate is +0.0050%. Bulls have a slight edge, but not an extreme one. The active buy/sell ratio of 0.83 clearly leans toward sellers taking control—so the order flow isn’t lying.
Get the levels straight; the conditions are set in stone.
For the short side, focus on the 0.6051 - 0.60706 zone first. It’s more suitable to wait for a pullback and pressure before confirming, not to act right at the current price.
If this range can hold down, the bearish logic stays valid. Then turn to the lower level observation for confirmation.
If price reclaims 0.6101 and stands back above it, the invalidation reference is reached; the bearish thesis is effectively over—don’t stubbornly hold.
If it breaks down below 0.5753 with increased volume, then watch support around 0.5738—that’s the extended downside observation level.
All the conditions are laid out. Trigger it, then act—don’t rush in early.
Let me say something blunt: the risk on the other side must be laid out.
The long/short ratio data shows longs hold only 36% of accounts, while shorts are already clearly crowded. If the pullback rebounds fast, it’s easy to get caught in the “soft underbelly” of crowded shorts—this is the biggest risk at this position.
The reference risk-reward ratio is 6.0, but a good-looking R/R doesn’t mean a high win rate. If the conditions don’t hold, don’t force this direction.
For reference only; not investment advice. Contracts carry leverage; investing involves risk.
This article was assisted by the Musk xAI Grok model.
$VIRTUAL
#Contract Outlook