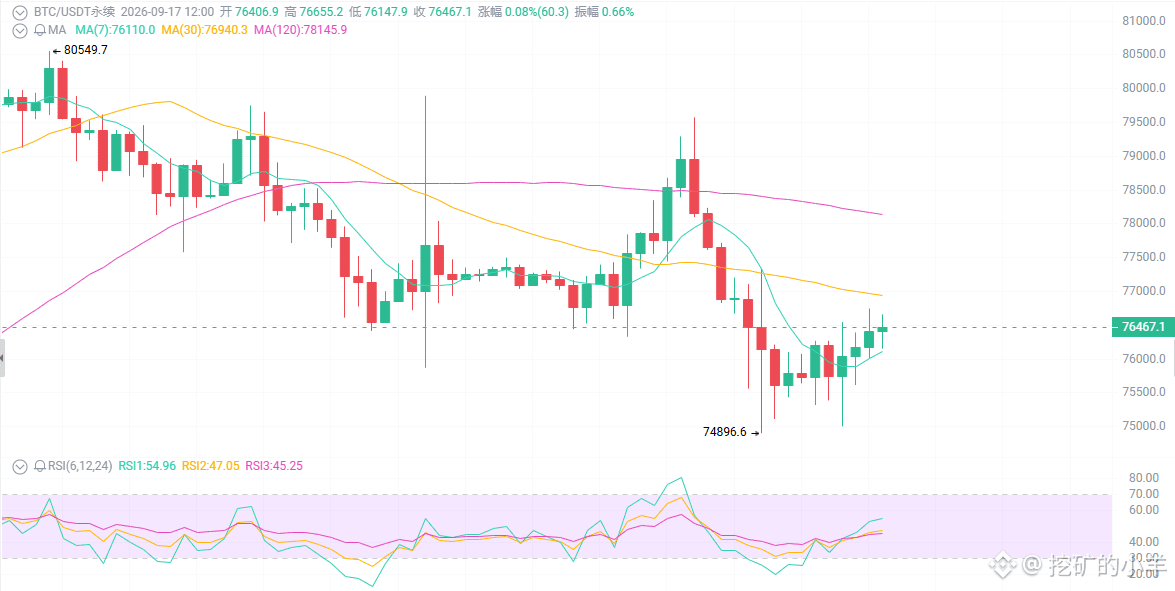
$76,450 BTC—are you still panicking?
First, take a look at the surface: a triple bearish shock, but the price hasn’t crashed.
After the FOMC meeting, the market was stunned. Rate hikes of 25 bps to 3.75%–4%. Fed Chair Warsh’s wording was: “Inflation isn’t fixed yet; there may be another hike by year-end.”
On the same day, a procedural vote on the market-structure bill failed 49–50. Two days of ETF net outflows totaled $746 million. After breaking out of the range, there was no acceleration downward—instead, price consolidated between 76,000 and 76,500.
When it doesn’t fall when it should, something strange is coming.
First thing: the rate hike is a real bearish catalyst, but the market has already “priced it in” too much.
On September 16, the Fed raised rates by 25 bps, and the dot plot suggested there’s still one more hike this year, pushing the rate to 4.1%.
The market’s first reaction was: “The rate-hike cycle has restarted,” and risk assets got hit across the board.
That day, BTC’s low was 74,900—yet now it’s still around 76,450. Why couldn’t it be smashed down? Because before the hike news even hit, the market had already baked in the worst-case expectations.
Second thing: the CLARITY bill was rejected, but the real nuclear bomb is in the House.
The Senate voted 49–50 against the procedural vote for the CLARITY bill, stalling the market-structure bill. In the same week, the House Financial Services Committee advanced the Strategic Bitcoin Reserve bill by 28–21.
Senate: keep dragging the regulatory bill (short-term bearish)
House: lock up seized/holding BTC for 20 years (mid-term “nuclear-level” bullish)
The regulatory narrative shifted from “may happen” to “keep dragging,” but the reserve narrative shifted from “nobody brings it up” to “official legislative progress.”
Third thing: the ETF is moving, but the structure hasn’t really broken
In the U.S. spot BTC ETF market, there were $746 million in net outflows over two days; IBIT and FBTC are the main redemption sources.
But total cumulative net inflows are still about $54.5 billion, and ETF AUM is around $95 billion, about 6.2% of market cap.
The structure hasn’t really broken—only marginal buy pressure has paused.
Trading plan
For short-term traders:
Try a low-position long between 75,500–75,800; stop-loss at 74,800 (daily close basis).
Reduce longs or try a low-position short between 77,100–77,500; stop-loss at 78,100.
For swing traders:
Wait for a daily close above 77,100 before considering adding.
On a pullback to 76,500–76,800, consider entering; stop-loss at 75,800; targets 78,600–80,000.
For long-term believers:
DCA in batches in the 73,500–71,300 zone. 71,300 is the major on-chain defense line—the first time it’s reached is more suitable for reducing shorts than adding shorts.
Hold for 1–2 years; the bet is on reserve legislation + existing ETF supply + the halving cycle.
Bear continuation scenario:
If the 4H candle closes below 75,000, and on the rebound 75,200–75,500 can’t break higher, then shorts target 73,500 → 71,300. Stop-loss: cover if price gets back above 76,000.
First time reaching 71,300: reduce shorts, don’t add shorts.
First, take a look at the surface: a triple bearish shock, but the price hasn’t crashed.
After the FOMC meeting, the market was stunned. Rate hikes of 25 bps to 3.75%–4%. Fed Chair Warsh’s wording was: “Inflation isn’t fixed yet; there may be another hike by year-end.”
On the same day, a procedural vote on the market-structure bill failed 49–50. Two days of ETF net outflows totaled $746 million. After breaking out of the range, there was no acceleration downward—instead, price consolidated between 76,000 and 76,500.
When it doesn’t fall when it should, something strange is coming.
First thing: the rate hike is a real bearish catalyst, but the market has already “priced it in” too much.
On September 16, the Fed raised rates by 25 bps, and the dot plot suggested there’s still one more hike this year, pushing the rate to 4.1%.
The market’s first reaction was: “The rate-hike cycle has restarted,” and risk assets got hit across the board.
That day, BTC’s low was 74,900—yet now it’s still around 76,450. Why couldn’t it be smashed down? Because before the hike news even hit, the market had already baked in the worst-case expectations.
Second thing: the CLARITY bill was rejected, but the real nuclear bomb is in the House.
The Senate voted 49–50 against the procedural vote for the CLARITY bill, stalling the market-structure bill. In the same week, the House Financial Services Committee advanced the Strategic Bitcoin Reserve bill by 28–21.
Senate: keep dragging the regulatory bill (short-term bearish)
House: lock up seized/holding BTC for 20 years (mid-term “nuclear-level” bullish)
The regulatory narrative shifted from “may happen” to “keep dragging,” but the reserve narrative shifted from “nobody brings it up” to “official legislative progress.”
Third thing: the ETF is moving, but the structure hasn’t really broken
In the U.S. spot BTC ETF market, there were $746 million in net outflows over two days; IBIT and FBTC are the main redemption sources.
But total cumulative net inflows are still about $54.5 billion, and ETF AUM is around $95 billion, about 6.2% of market cap.
The structure hasn’t really broken—only marginal buy pressure has paused.
Trading plan
For short-term traders:
Try a low-position long between 75,500–75,800; stop-loss at 74,800 (daily close basis).
Reduce longs or try a low-position short between 77,100–77,500; stop-loss at 78,100.
For swing traders:
Wait for a daily close above 77,100 before considering adding.
On a pullback to 76,500–76,800, consider entering; stop-loss at 75,800; targets 78,600–80,000.
For long-term believers:
DCA in batches in the 73,500–71,300 zone. 71,300 is the major on-chain defense line—the first time it’s reached is more suitable for reducing shorts than adding shorts.
Hold for 1–2 years; the bet is on reserve legislation + existing ETF supply + the halving cycle.
Bear continuation scenario:
If the 4H candle closes below 75,000, and on the rebound 75,200–75,500 can’t break higher, then shorts target 73,500 → 71,300. Stop-loss: cover if price gets back above 76,000.
First time reaching 71,300: reduce shorts, don’t add shorts.