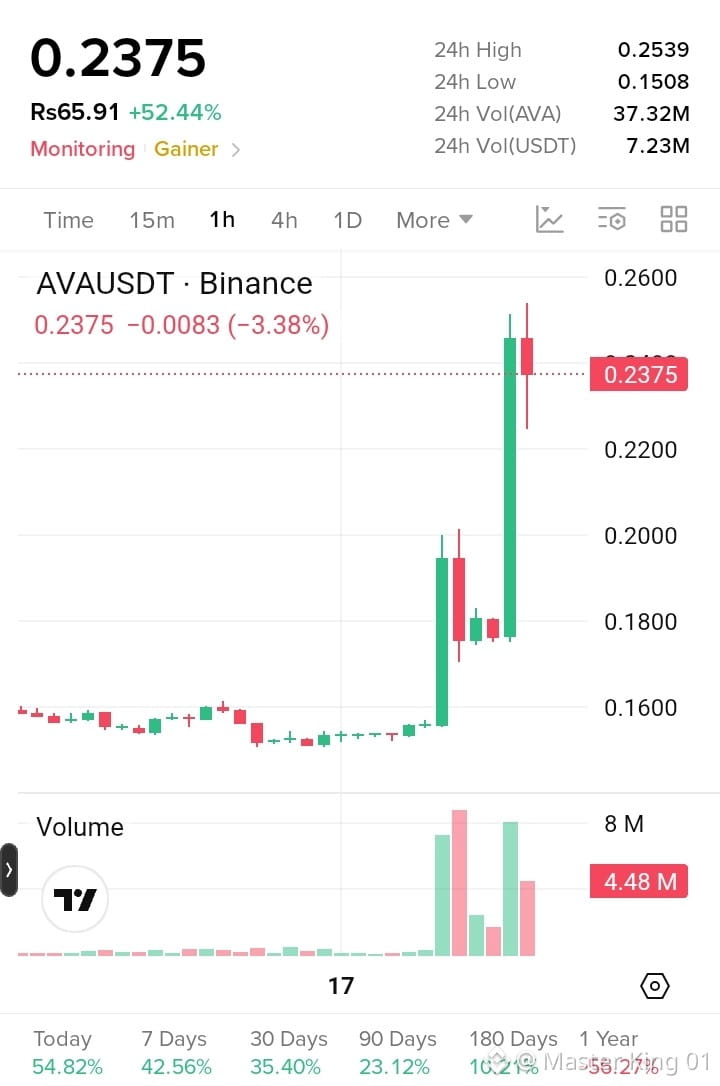
$AVA /USDT — 1H chart analysis 📊
Price: 0.2375
24h high: 0.2539
24h low: 0.1508
24h change: +52.44%
RSI: 65.91
🔎 Chart structure
AVA has made a very sharp breakout from roughly 0.155 → 0.25. Volume increased significantly, so the move has strong momentum.
However, the latest 1H candle is red and has a long lower wick, showing that sellers pushed price down but buyers stepped back in.
Key levels from this chart:
🟢 0.230–0.235: immediate support
🟢 0.220: next support
🟡 0.250–0.254: major resistance / recent high
🚀 Above 0.254: a clean 1H breakout could open the way for price discovery, but confirmation matters.
🔻 Below 0.220: momentum would weaken considerably; 0.20 becomes an important area to watch.
⚠️ Important
RSI around 66 is strong but approaching overbought territory. Combined with a 52% daily pump, chasing the price at the current level carries higher volatility.
're considering an entry, I'd watch how the 0.230–0.220 zone reacts rather than assuming the current candle will continue upward.
Price: 0.2375
24h high: 0.2539
24h low: 0.1508
24h change: +52.44%
RSI: 65.91
🔎 Chart structure
AVA has made a very sharp breakout from roughly 0.155 → 0.25. Volume increased significantly, so the move has strong momentum.
However, the latest 1H candle is red and has a long lower wick, showing that sellers pushed price down but buyers stepped back in.
Key levels from this chart:
🟢 0.230–0.235: immediate support
🟢 0.220: next support
🟡 0.250–0.254: major resistance / recent high
🚀 Above 0.254: a clean 1H breakout could open the way for price discovery, but confirmation matters.
🔻 Below 0.220: momentum would weaken considerably; 0.20 becomes an important area to watch.
⚠️ Important
RSI around 66 is strong but approaching overbought territory. Combined with a 52% daily pump, chasing the price at the current level carries higher volatility.
're considering an entry, I'd watch how the 0.230–0.220 zone reacts rather than assuming the current candle will continue upward.