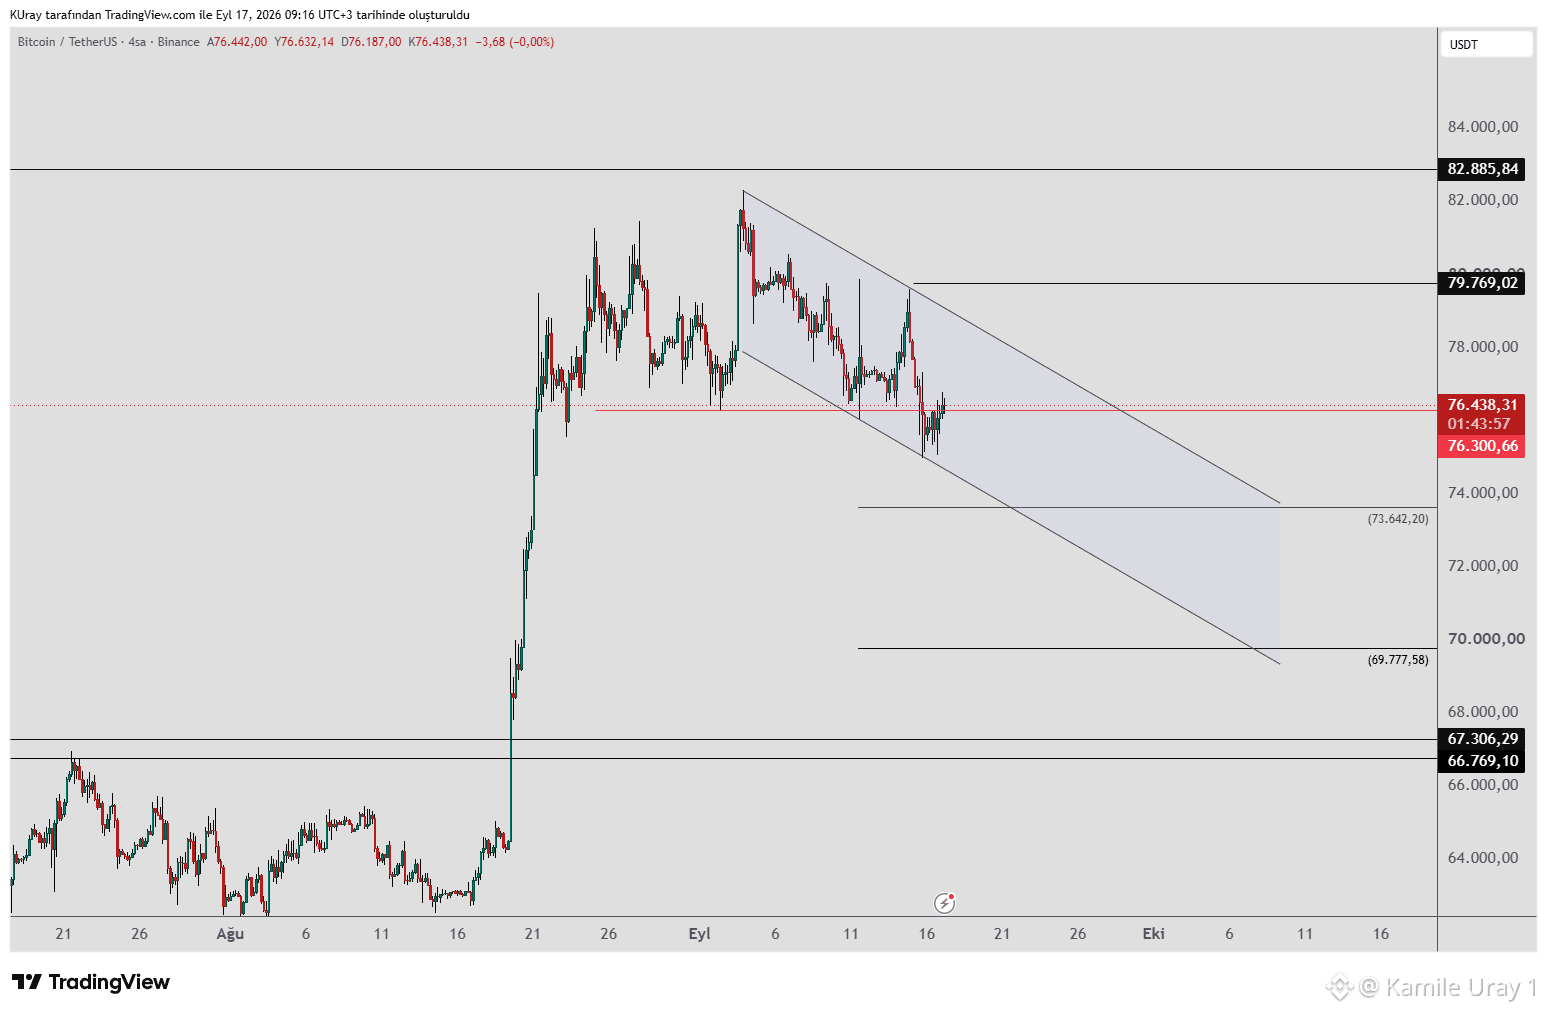
#BTC The downward wave is moving within a channel. The upper band of this channel may act as resistance, while the lower band acts as support. As long as the upper band remains unbroken (a breakout would require a daily close around 79,800), there is a possibility that the decline will continue.
During the decline, we will monitor support levels at 73,642, 69,777, 67,306, and 66,769. If buying pressure emerges at any of these levels, a renewed rise is expected. The decline could potentially form the final shoulder of an Inverse Head and Shoulders (IH&S) pattern; if the price holds above 83,000, the pattern would activate, and a continued rise toward upper resistance levels would be anticipated.
If a daily or weekly close occurs above 82,885, it would mark the first higher peak relative to the recent downward wave. This would provide a further signal that the upward trend is likely to continue, after which we can monitor the upper resistance levels.
During the decline, we will monitor support levels at 73,642, 69,777, 67,306, and 66,769. If buying pressure emerges at any of these levels, a renewed rise is expected. The decline could potentially form the final shoulder of an Inverse Head and Shoulders (IH&S) pattern; if the price holds above 83,000, the pattern would activate, and a continued rise toward upper resistance levels would be anticipated.
If a daily or weekly close occurs above 82,885, it would mark the first higher peak relative to the recent downward wave. This would provide a further signal that the upward trend is likely to continue, after which we can monitor the upper resistance levels.