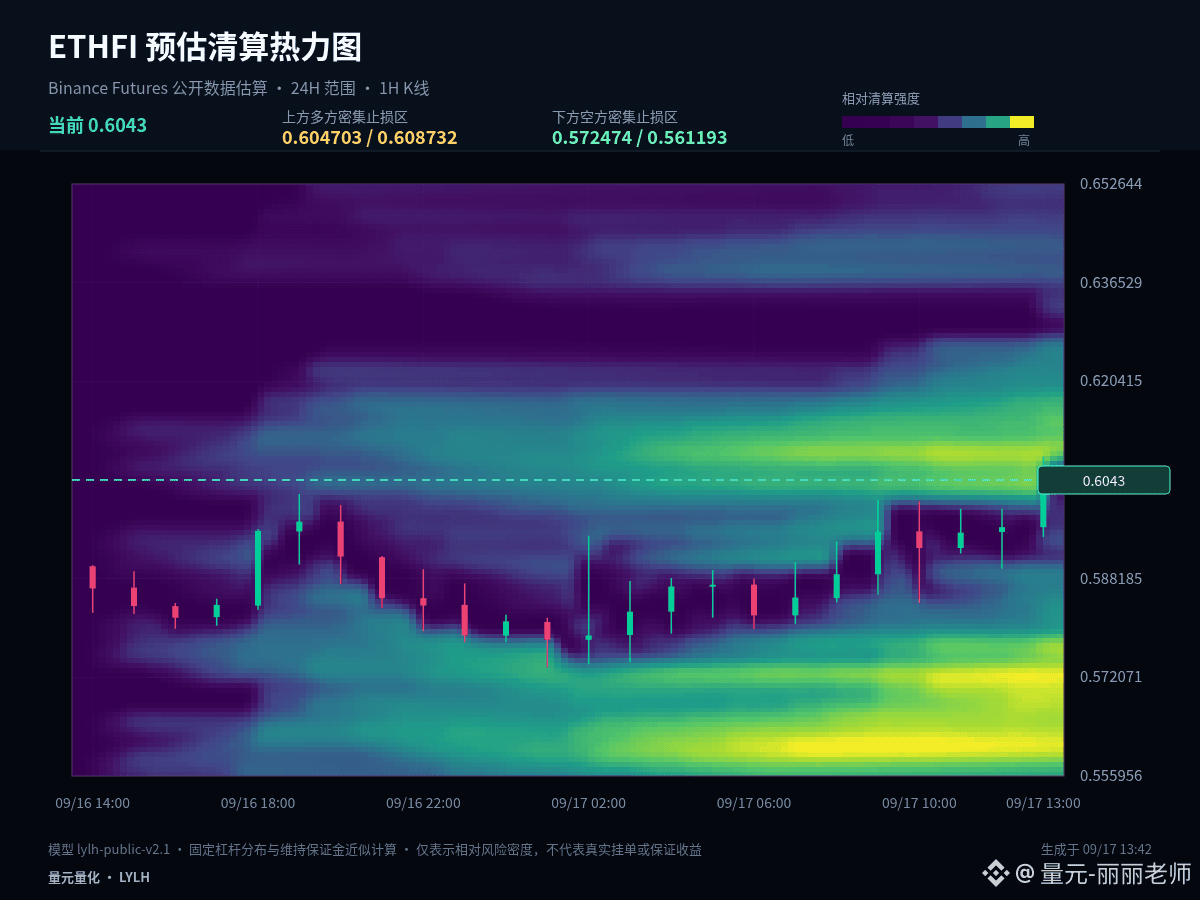
$ETHFI #ETHFI has already moved into the upper bound of the last 24-hour range for nearly 24 hours. The most important thing to confirm at this point is whether there is a valid breakout, or merely a rebound after a spike followed by a quick pullback.
Current price is close to the upper limit of the past 24-hour fluctuation range: +1.29% for 1 hour and +2.56% for 24 hours. At the highs, the key is to confirm the market’s acceptance after the breakout: if price can stay above the upper band, it indicates the market is acknowledging a higher range. If it only pierces briefly and quickly retreats, you need to guard against a false breakout.
Regarding key levels, 0.59225 is the structural pivot of the current setup and is the first standard to judge whether any pullback is healthy. As long as price can hold steadily above it, the bulls still retain initiative. Above that, the next area to watch is 0.6097. If price falls back below the pivot, attention should shift to the secondary support at 0.5748.
For execution, set clear conditions: after breaking above 0.6097, you need confirmation—not chase just because of a momentary surge. After dipping to 0.5748, you should see whether it can quickly reclaim the level—not buy just because you see a drop. If the middle zone doesn’t offer sufficient reward-to-risk, waiting itself is part of the strategy.
For those holding existing positions, the focus is to manage based on whether support actually fails, rather than letting every fluctuation pull you around. For those currently in cash, prioritize waiting for a breakout-and-retest scenario or support confirmation. Spot can be scaled in batches, while for futures you should shorten the decision chain: first determine your stop-loss level, then decide whether to participate.
Next, I will focus on tracking the gains and losses around 0.59225. Do you lean more toward testing 0.6097 first, or going back to 0.5748 first? Feel free to share your view and your reasoning.
#FedHikes25BpsUSStocksClose
Current price is close to the upper limit of the past 24-hour fluctuation range: +1.29% for 1 hour and +2.56% for 24 hours. At the highs, the key is to confirm the market’s acceptance after the breakout: if price can stay above the upper band, it indicates the market is acknowledging a higher range. If it only pierces briefly and quickly retreats, you need to guard against a false breakout.
Regarding key levels, 0.59225 is the structural pivot of the current setup and is the first standard to judge whether any pullback is healthy. As long as price can hold steadily above it, the bulls still retain initiative. Above that, the next area to watch is 0.6097. If price falls back below the pivot, attention should shift to the secondary support at 0.5748.
For execution, set clear conditions: after breaking above 0.6097, you need confirmation—not chase just because of a momentary surge. After dipping to 0.5748, you should see whether it can quickly reclaim the level—not buy just because you see a drop. If the middle zone doesn’t offer sufficient reward-to-risk, waiting itself is part of the strategy.
For those holding existing positions, the focus is to manage based on whether support actually fails, rather than letting every fluctuation pull you around. For those currently in cash, prioritize waiting for a breakout-and-retest scenario or support confirmation. Spot can be scaled in batches, while for futures you should shorten the decision chain: first determine your stop-loss level, then decide whether to participate.
Next, I will focus on tracking the gains and losses around 0.59225. Do you lean more toward testing 0.6097 first, or going back to 0.5748 first? Feel free to share your view and your reasoning.
#FedHikes25BpsUSStocksClose