$Hakimi, this move has something.
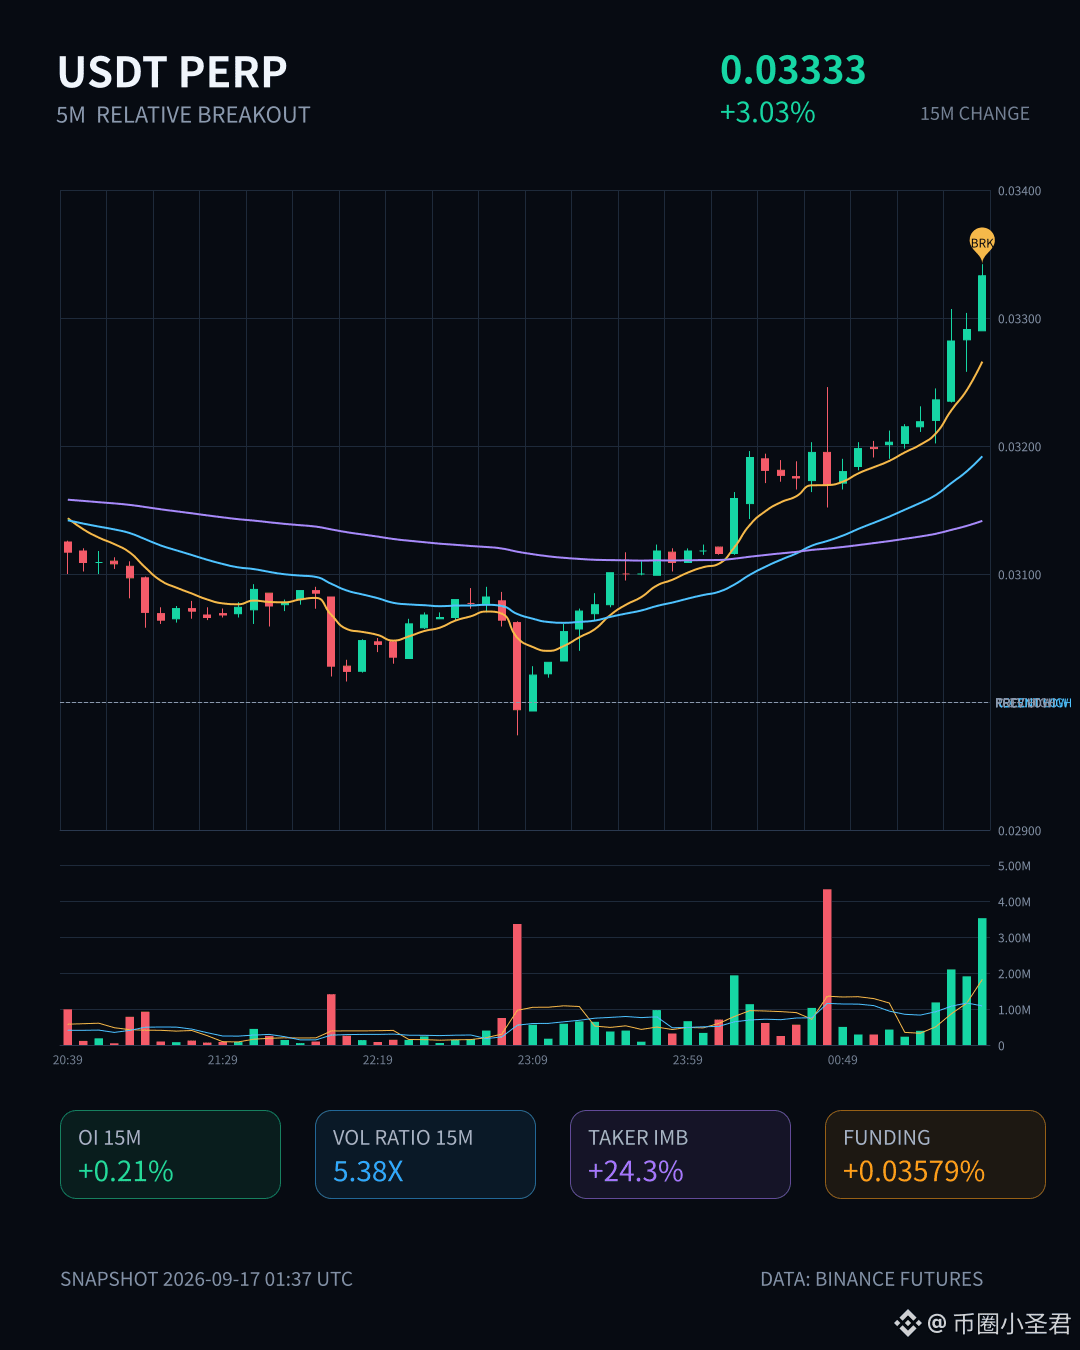
On the 15m chart it surged straight up 3 percentage points, with volume reaching 5.38x the usual level, and a Z value of 3.02—not one of those flimsy “fake breakout” types.
The closing price has already broken above the upper band of the last ~20 consecutive 5m K bars. The active buy/sell ratio is 1.64, with buy pressure leaning to 24.3%, indicating people are sweeping upward rather than just leaving orders sitting there waiting for trades.
What’s even more interesting is the OI. On 15m it’s +0.21%, and on 1h it’s +0.45%. The absolute change isn’t huge (208K / 344K), but the anomaly percentile hits 98%—and the whole pool’s anomaly ranks #5. Price is rising together with OI, which is a classic sign of leveraged longs adding new positions, not short-covering or a one-off “buy and stop” event.
Also, it’s continuing across multiple consecutive periods, not just a single spike.
In the last 24h, the trade value is 6.76M. The depth isn’t particularly thick, and in this kind of smaller pool, OI showing an abnormal continued climb is something to watch—could it be that someone is laying groundwork in advance?
Nominal change ranks #39 in the whole pool: it’s near the front but not the very top, which makes me think it may still be relatively early?
Anyway, I like this kind of structure—volume-price alignment + OI confirmation + active trading bias all lined up. Whether it can keep going depends on whether the next few 5m candles can hold the upper band.
On the 15m chart it surged straight up 3 percentage points, with volume reaching 5.38x the usual level, and a Z value of 3.02—not one of those flimsy “fake breakout” types.
The closing price has already broken above the upper band of the last ~20 consecutive 5m K bars. The active buy/sell ratio is 1.64, with buy pressure leaning to 24.3%, indicating people are sweeping upward rather than just leaving orders sitting there waiting for trades.
What’s even more interesting is the OI. On 15m it’s +0.21%, and on 1h it’s +0.45%. The absolute change isn’t huge (208K / 344K), but the anomaly percentile hits 98%—and the whole pool’s anomaly ranks #5. Price is rising together with OI, which is a classic sign of leveraged longs adding new positions, not short-covering or a one-off “buy and stop” event.
Also, it’s continuing across multiple consecutive periods, not just a single spike.
In the last 24h, the trade value is 6.76M. The depth isn’t particularly thick, and in this kind of smaller pool, OI showing an abnormal continued climb is something to watch—could it be that someone is laying groundwork in advance?
Nominal change ranks #39 in the whole pool: it’s near the front but not the very top, which makes me think it may still be relatively early?
Anyway, I like this kind of structure—volume-price alignment + OI confirmation + active trading bias all lined up. Whether it can keep going depends on whether the next few 5m candles can hold the upper band.