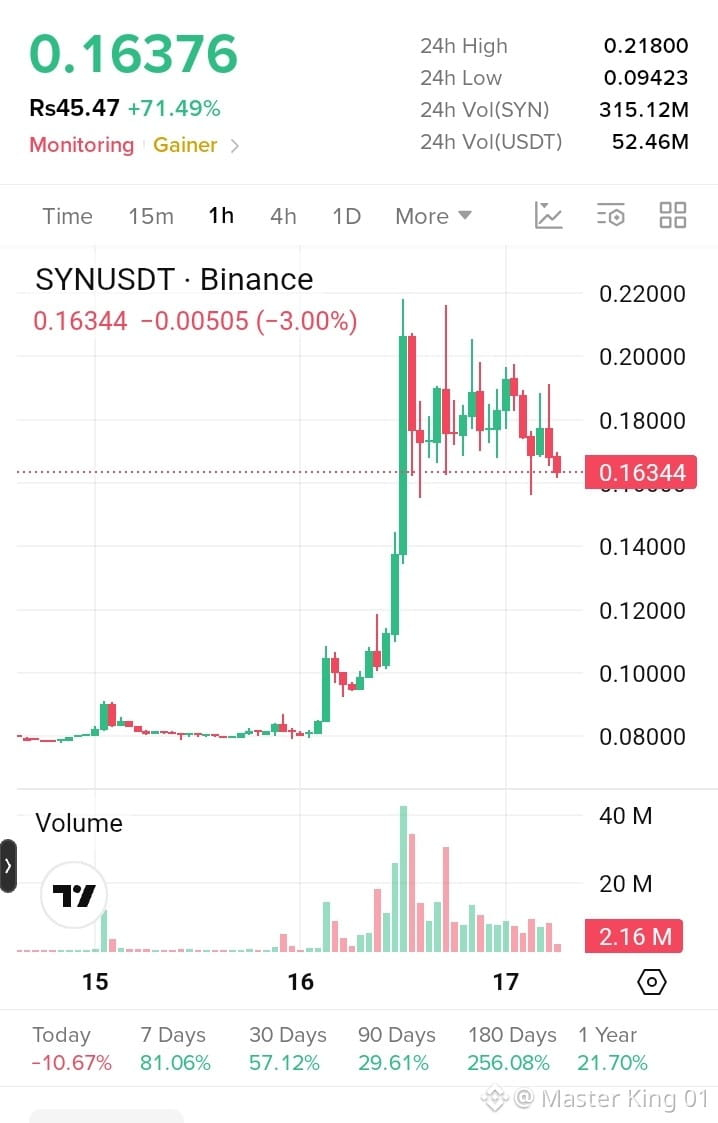
$SYN /USDT Binance chart you shared:
Current: ~0.1634
24h high: 0.2180
24h low: 0.0942
24h change: +71.5%
Price has made a very large breakout and is now consolidating around 0.16–0.19.
Key levels from this chart
Level Meaning
0.160–0.163 Immediate support / current area
0.150–0.155 Next support if 0.16 breaks
0.140 Important breakout-area support
0.175–0.180 First resistance
0.190–0.200 Stronger resistance
0.218 Recent high / major resistance
What the candles suggest
The initial move from roughly 0.10 → 0.21 happened with very high volume. Since then, SYN has been making a volatile sideways consolidation, with repeated rejection around 0.19–0.20.
Right now, price is near the lower part of that consolidation. The latest candles are bearish, so 0.16 is an important level to watch.
Bullish scenario: If price holds ~0.16 and reclaims 0.175–0.18, the chart could attempt another move toward 0.19–0.20, with 0.218 being the major previous high.
Bearish scenario: A decisive 1H breakdown below 0.16 could expose 0.15–0.155, followed by the 0.14 area.
Because the coin has already moved ~70% in 24h, volatility and fake breakouts are particularly important here. I wouldn't treat any single candle as confirmation.
If you tell me your entry price and whether you're holding spot or a long/short, I can map out the chart's support, resistance, stop-loss and potential target zones specifically around your position.
Current: ~0.1634
24h high: 0.2180
24h low: 0.0942
24h change: +71.5%
Price has made a very large breakout and is now consolidating around 0.16–0.19.
Key levels from this chart
Level Meaning
0.160–0.163 Immediate support / current area
0.150–0.155 Next support if 0.16 breaks
0.140 Important breakout-area support
0.175–0.180 First resistance
0.190–0.200 Stronger resistance
0.218 Recent high / major resistance
What the candles suggest
The initial move from roughly 0.10 → 0.21 happened with very high volume. Since then, SYN has been making a volatile sideways consolidation, with repeated rejection around 0.19–0.20.
Right now, price is near the lower part of that consolidation. The latest candles are bearish, so 0.16 is an important level to watch.
Bullish scenario: If price holds ~0.16 and reclaims 0.175–0.18, the chart could attempt another move toward 0.19–0.20, with 0.218 being the major previous high.
Bearish scenario: A decisive 1H breakdown below 0.16 could expose 0.15–0.155, followed by the 0.14 area.
Because the coin has already moved ~70% in 24h, volatility and fake breakouts are particularly important here. I wouldn't treat any single candle as confirmation.
If you tell me your entry price and whether you're holding spot or a long/short, I can map out the chart's support, resistance, stop-loss and potential target zones specifically around your position.