Trading Thesis|9/17 09:21
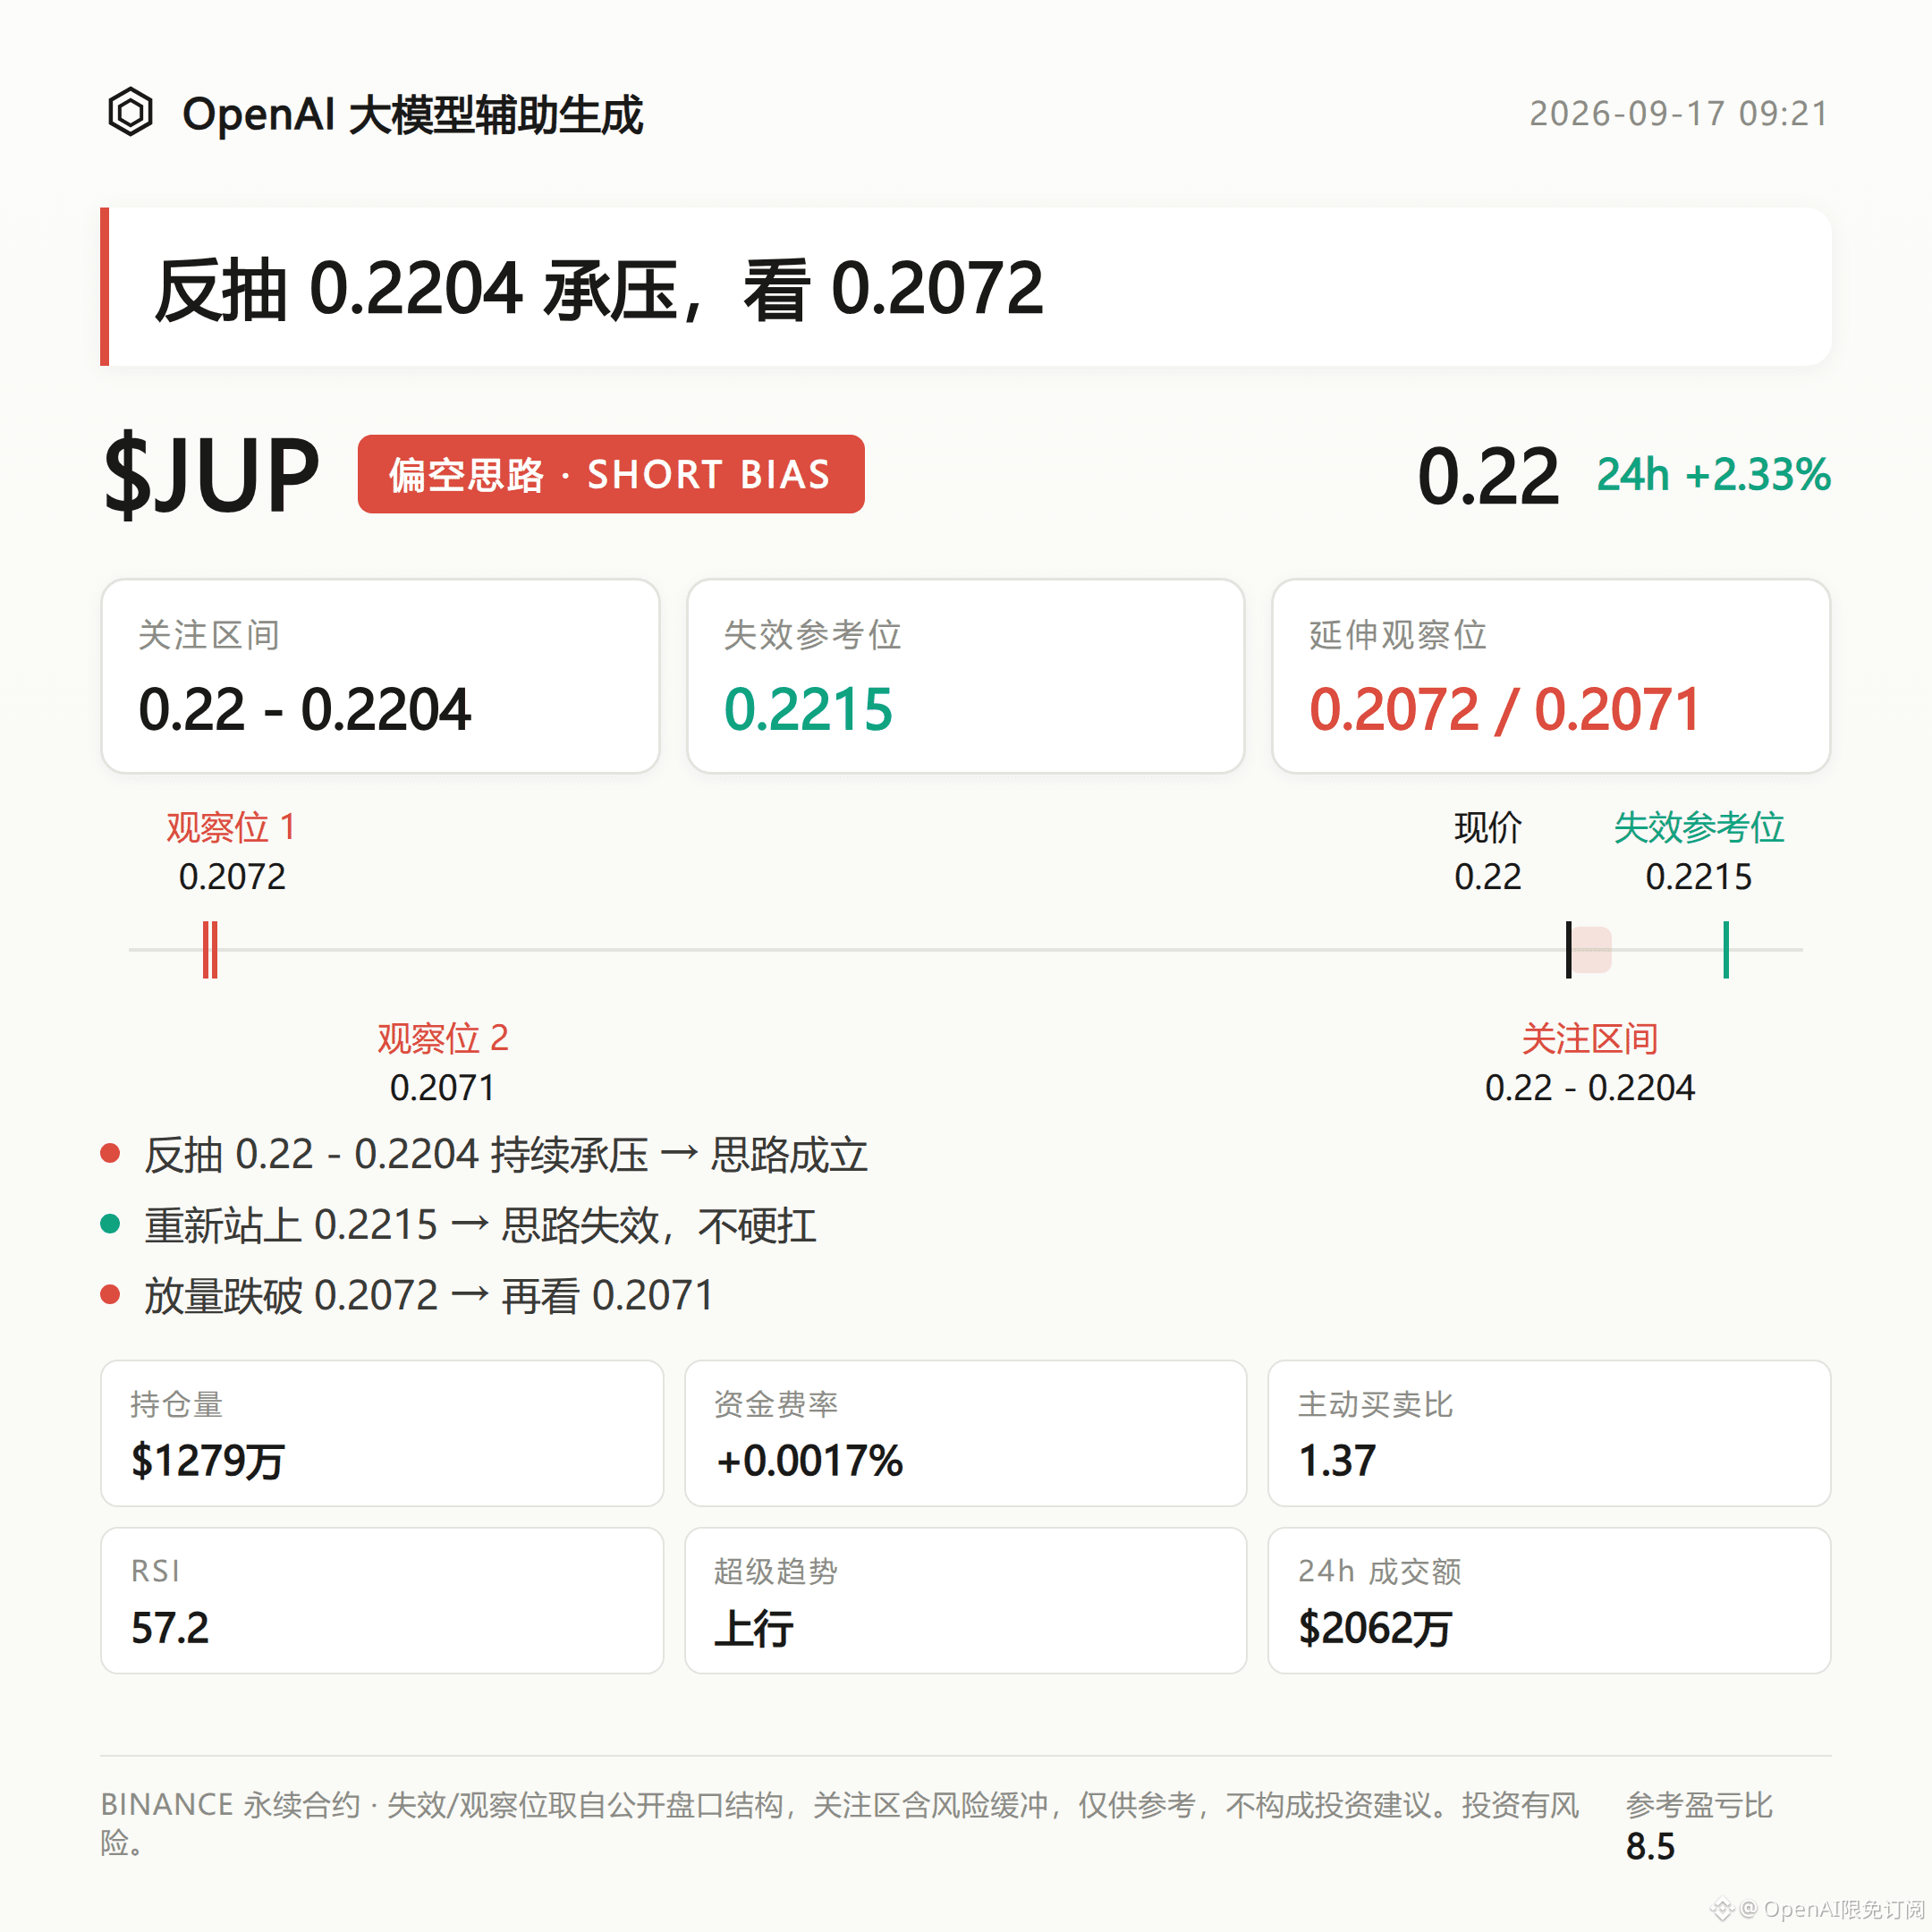
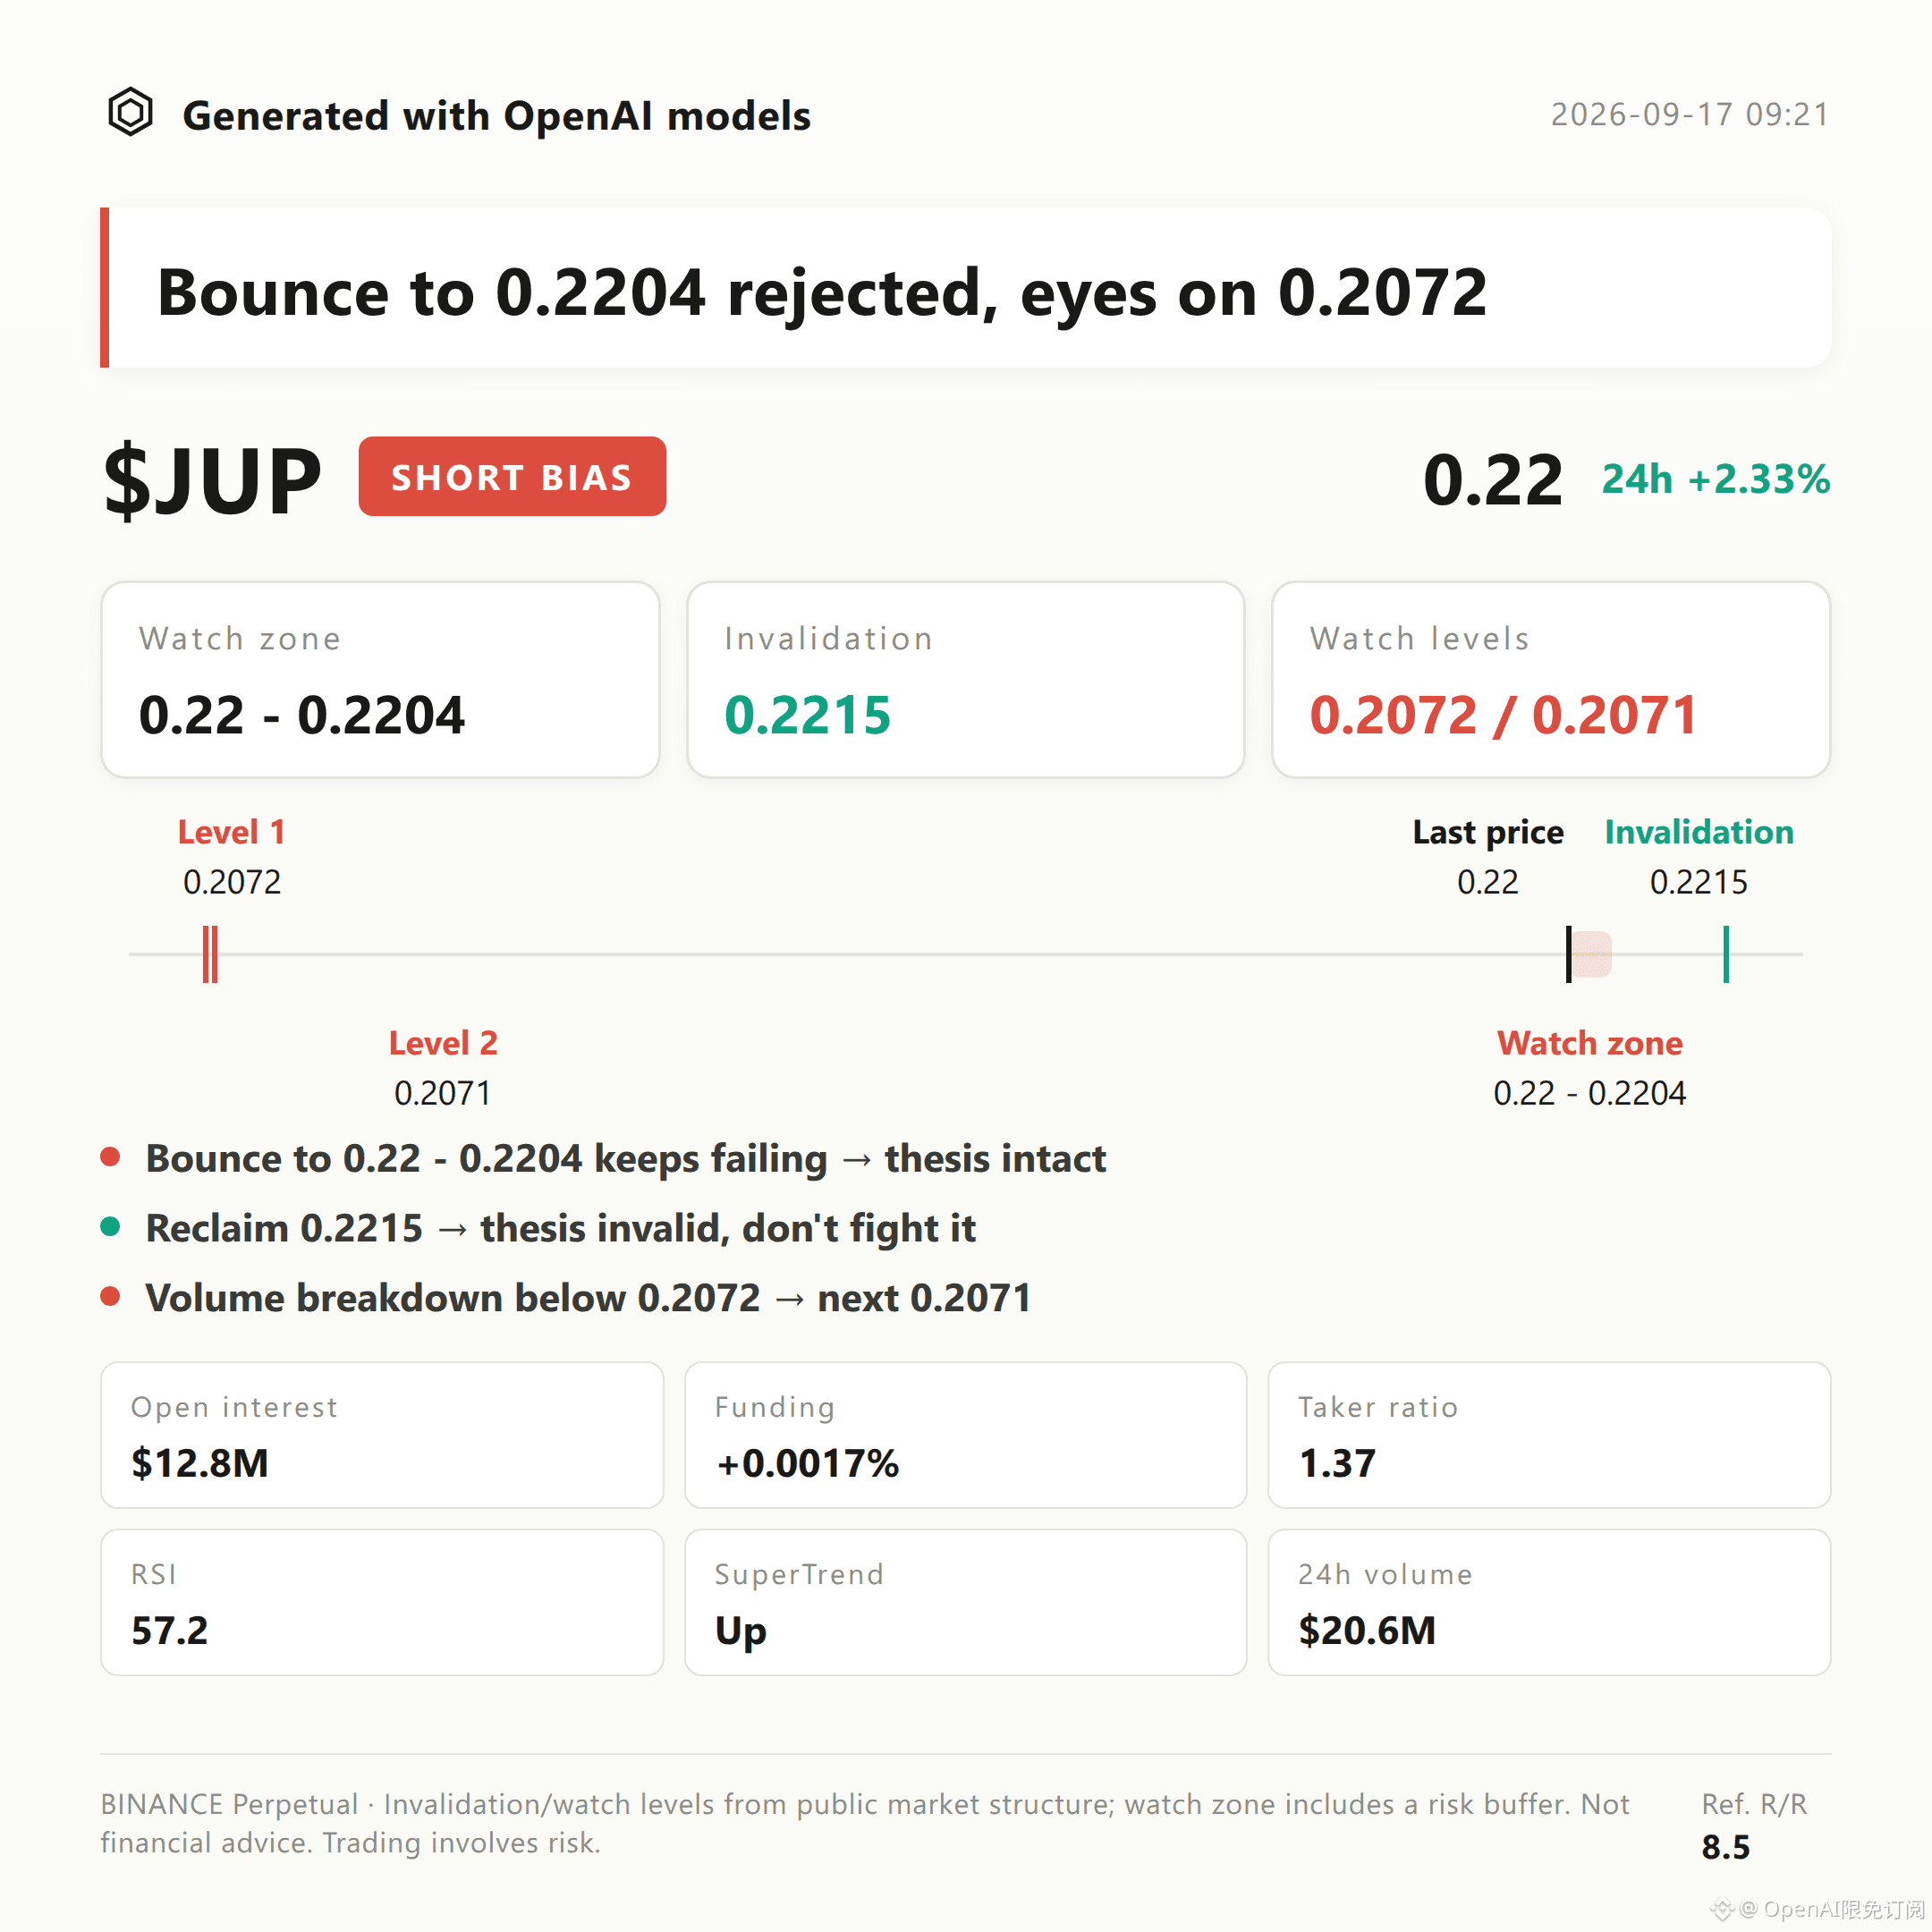
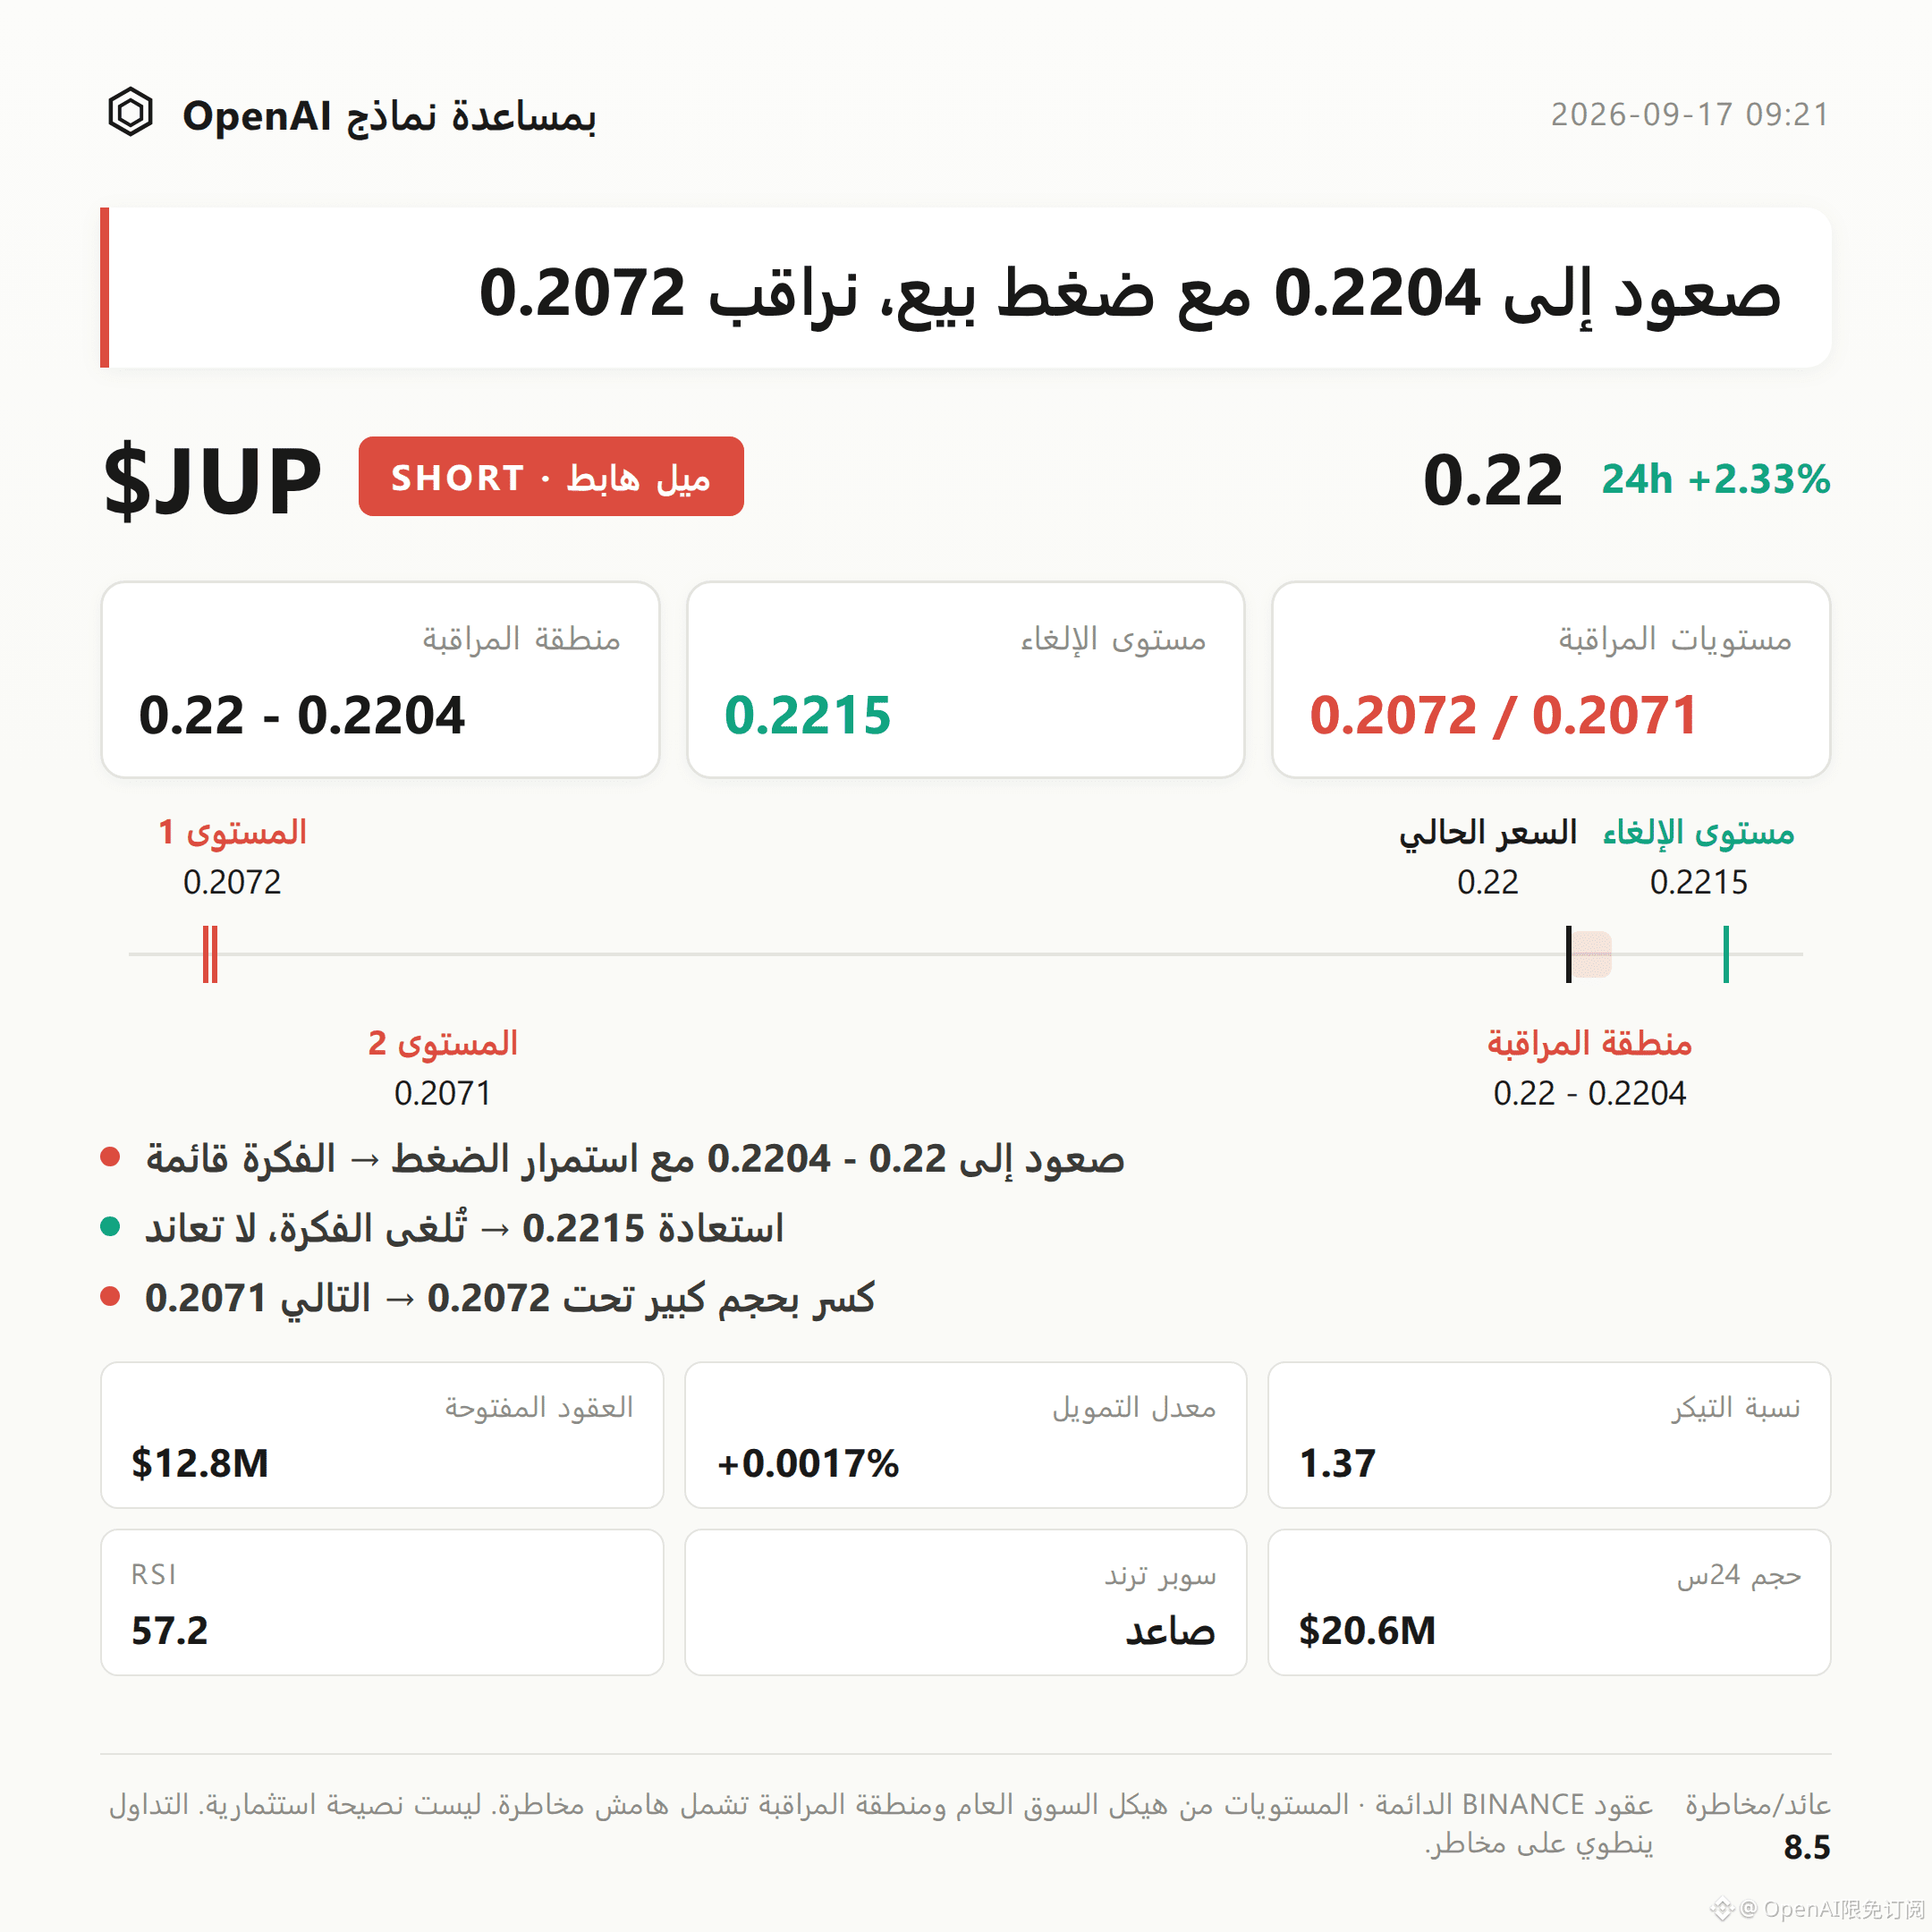
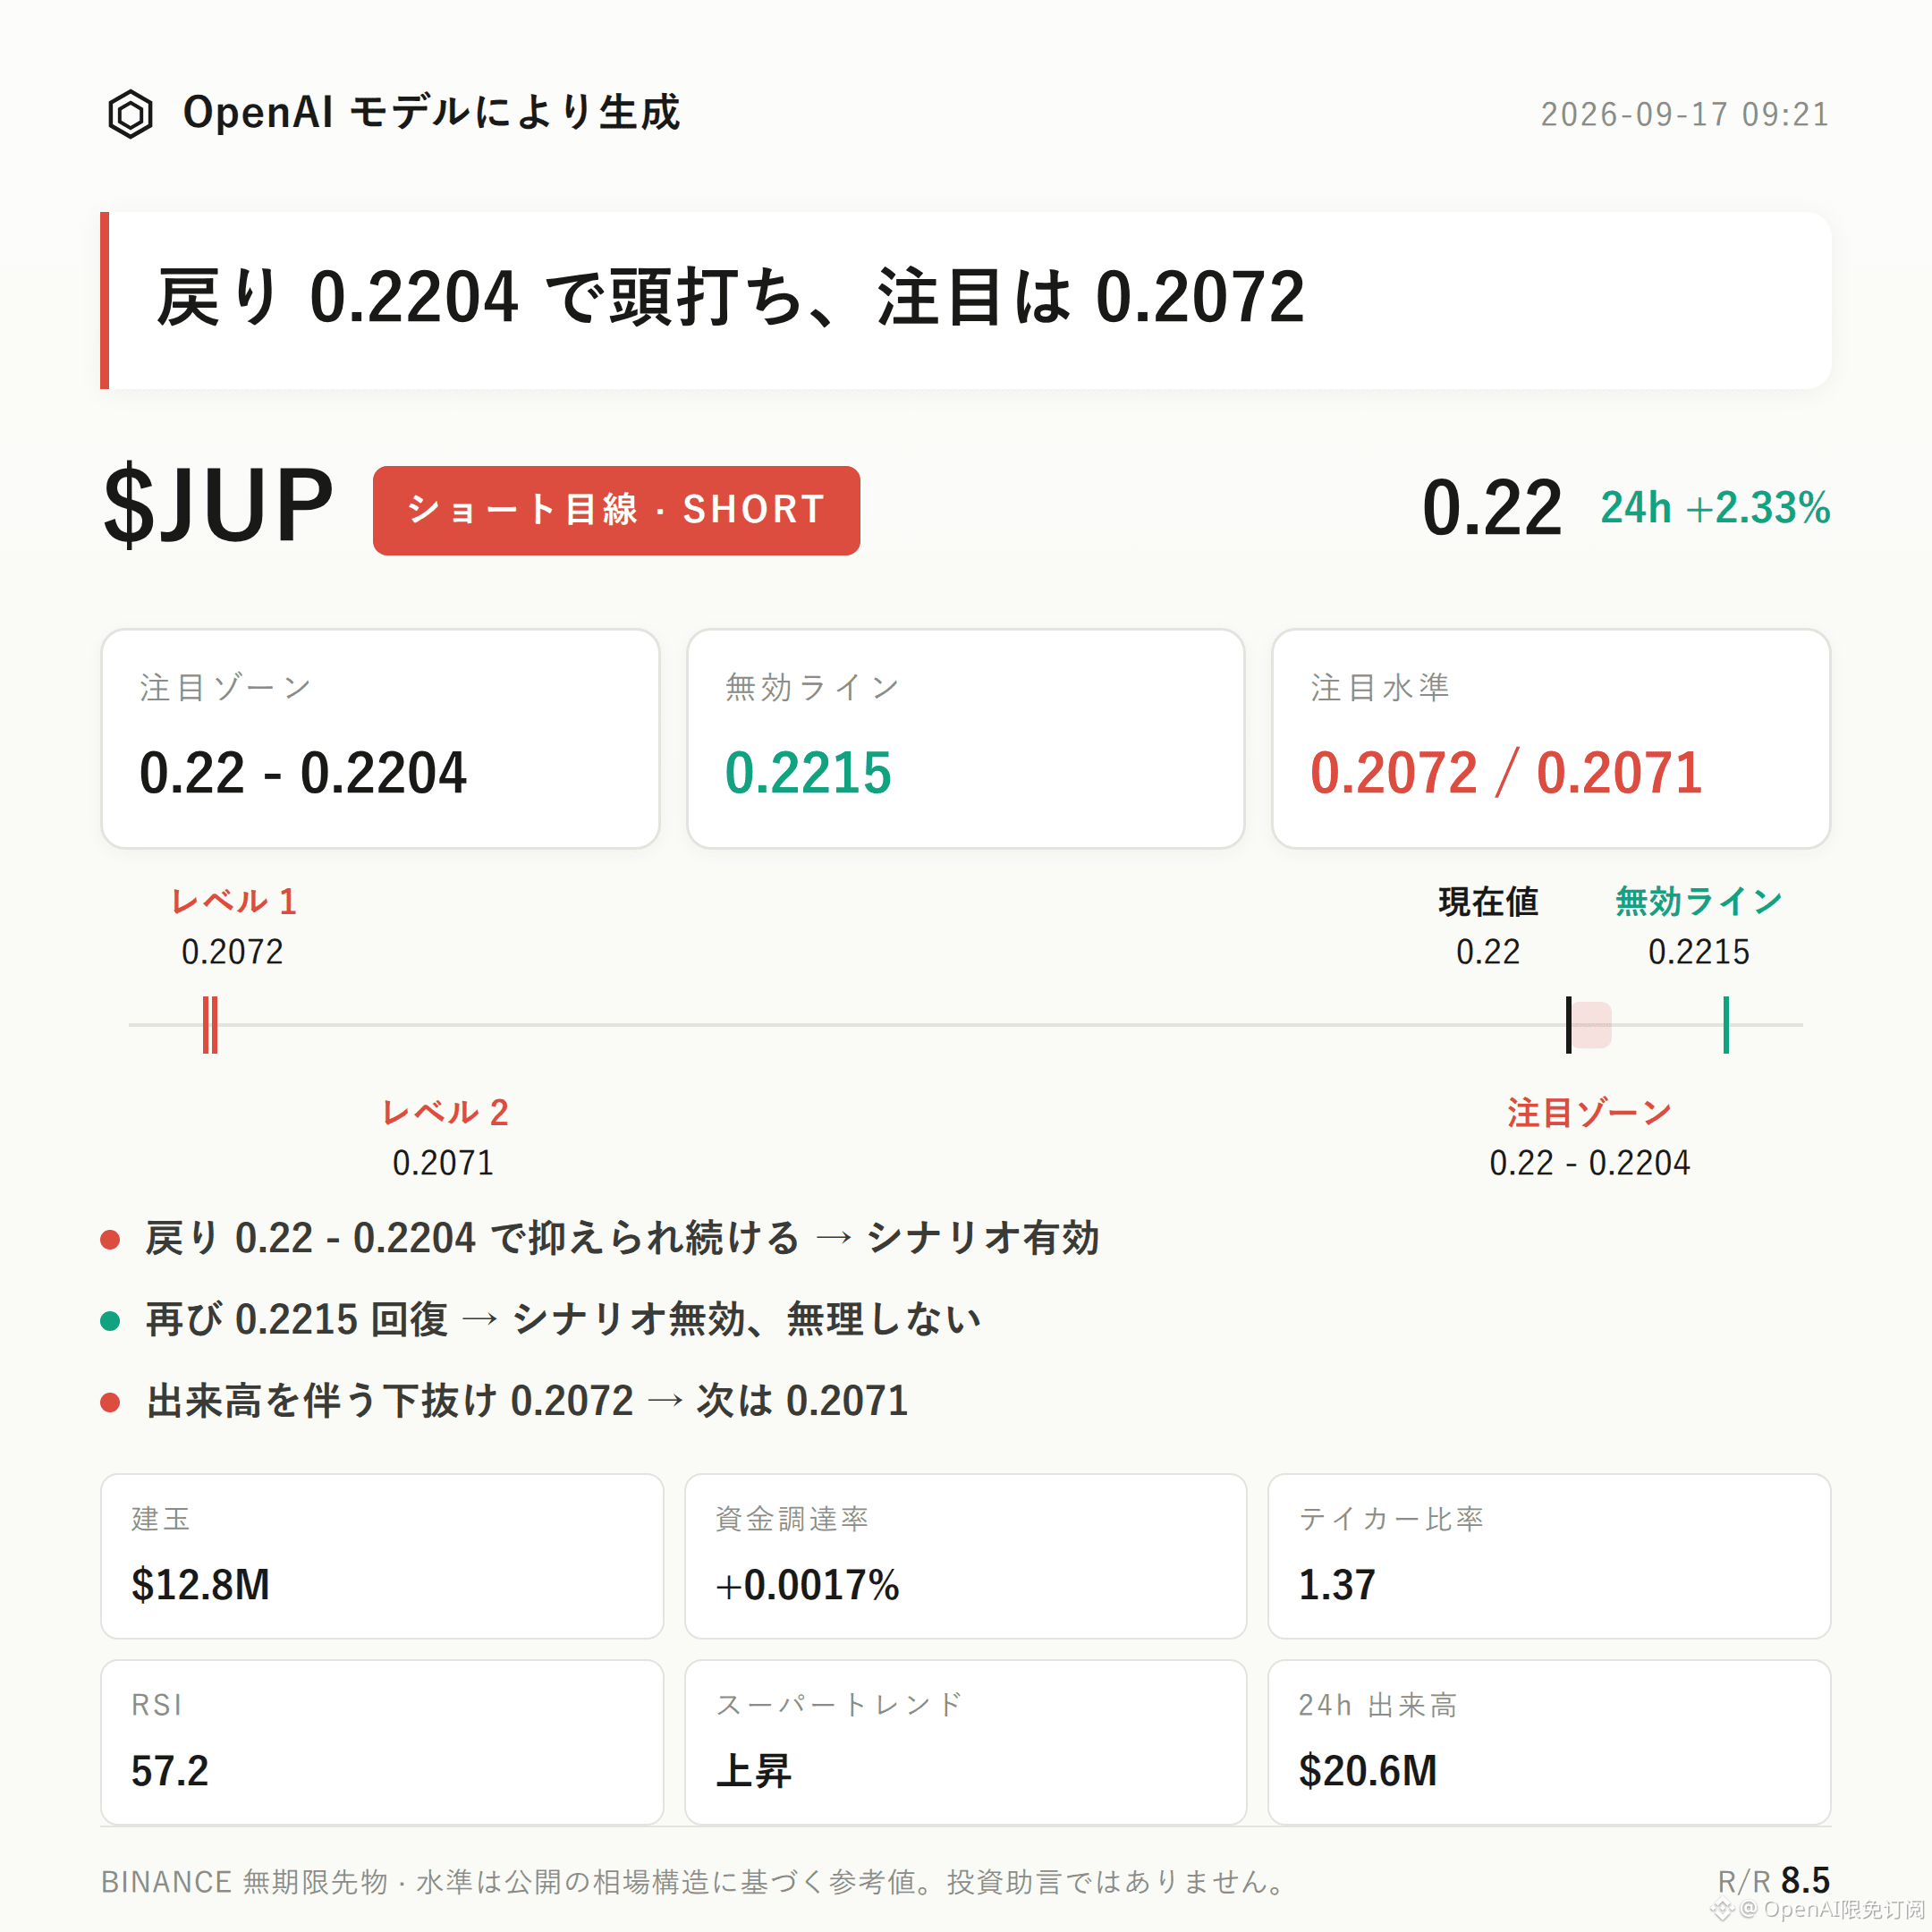
$JUP Bearish Bias|Watch Range 0.22 - 0.2204 | Invalidation Reference 0.2215 | Observation Level 0.2072 / 0.2071
$JUP is currently following a bearish-leaning structure.
On the key point, the MACD shows bearish momentum; the current price is running below the recent high of 0.2215, and that level corresponds to pressure near the upper Bollinger Band at about 0.2197.
The focus is whether the rebound can be capped in the resistance zone, rather than making a bearish call directly from the current price.
From the technical structure: the recent high is 0.2215, the recent low is 0.2071, and the 24-hour price change is +2.33%. The current price around 0.22 is near the top of the range.
The Bollinger Bands are: upper 0.2197, middle 0.2135, lower 0.2072; price is moving along the upper band.
Need to state truthfully: RSI is 57.2, which is in a neutral-to-bullish range. The SuperTrend indicator is still marked upward, so technical signals are not fully consistent. The bearish structure at the moment is mainly supported by the MACD evidence.
For derivatives data: 24-hour trading volume is $20.62 million, open interest is $12.79 million, 24-hour change +6.0%, funding rate +0.0017%. The funding is mild and no obvious one-way squeeze is visible.
For long/short accounts: longs are 38%. The account structure suggests shorts are relatively crowded. The active buy/sell ratio is 1.37, meaning active buying is still stronger than selling; short-term sentiment has not yet shifted to bearish.
On reference levels: for the short side, first watch the bearish zone 0.22 - 0.2204. It is more suitable to wait for confirmation after a rebound meets resistance, rather than extrapolating directly from the current price.
If, after the rebound into that range, price rises into resistance, shows capping/pressure signals, then the bearish thesis structure is established.
If price moves back above the invalidation reference at 0.2215, it means the current pullback structure is broken; the bearish thesis is invalid, and you should not continue to project it based on the original idea.
If below breaks the observation level 0.2072 with increased volume, then look toward support near 0.2071—since that area corresponds to the recent low, it has some reference value.
The reference risk/reward of 8.5 is only structural reference and does not represent actual results.
Reverse risks must be disclosed honestly: the current longs account for only 38%, while short positions are relatively crowded. The active buy/sell ratio is 1.37, indicating active buying remains relatively strong; this directly conflicts with the bearish thesis. If short-term sentiment strengthens further, the rebound strength could exceed expectations.
Under contract leverage, position discipline is more important than directional judgment.
For reference only and does not constitute investment advice. Contracts involve leverage; investing involves risk.
This article was generated with assistance from an OpenAI model.
$JUP #Contract Analysis
$JUP Bearish Bias|Watch Range 0.22 - 0.2204 | Invalidation Reference 0.2215 | Observation Level 0.2072 / 0.2071
$JUP is currently following a bearish-leaning structure.
On the key point, the MACD shows bearish momentum; the current price is running below the recent high of 0.2215, and that level corresponds to pressure near the upper Bollinger Band at about 0.2197.
The focus is whether the rebound can be capped in the resistance zone, rather than making a bearish call directly from the current price.
From the technical structure: the recent high is 0.2215, the recent low is 0.2071, and the 24-hour price change is +2.33%. The current price around 0.22 is near the top of the range.
The Bollinger Bands are: upper 0.2197, middle 0.2135, lower 0.2072; price is moving along the upper band.
Need to state truthfully: RSI is 57.2, which is in a neutral-to-bullish range. The SuperTrend indicator is still marked upward, so technical signals are not fully consistent. The bearish structure at the moment is mainly supported by the MACD evidence.
For derivatives data: 24-hour trading volume is $20.62 million, open interest is $12.79 million, 24-hour change +6.0%, funding rate +0.0017%. The funding is mild and no obvious one-way squeeze is visible.
For long/short accounts: longs are 38%. The account structure suggests shorts are relatively crowded. The active buy/sell ratio is 1.37, meaning active buying is still stronger than selling; short-term sentiment has not yet shifted to bearish.
On reference levels: for the short side, first watch the bearish zone 0.22 - 0.2204. It is more suitable to wait for confirmation after a rebound meets resistance, rather than extrapolating directly from the current price.
If, after the rebound into that range, price rises into resistance, shows capping/pressure signals, then the bearish thesis structure is established.
If price moves back above the invalidation reference at 0.2215, it means the current pullback structure is broken; the bearish thesis is invalid, and you should not continue to project it based on the original idea.
If below breaks the observation level 0.2072 with increased volume, then look toward support near 0.2071—since that area corresponds to the recent low, it has some reference value.
The reference risk/reward of 8.5 is only structural reference and does not represent actual results.
Reverse risks must be disclosed honestly: the current longs account for only 38%, while short positions are relatively crowded. The active buy/sell ratio is 1.37, indicating active buying remains relatively strong; this directly conflicts with the bearish thesis. If short-term sentiment strengthens further, the rebound strength could exceed expectations.
Under contract leverage, position discipline is more important than directional judgment.
For reference only and does not constitute investment advice. Contracts involve leverage; investing involves risk.
This article was generated with assistance from an OpenAI model.
$JUP #Contract Analysis