

The CLARITY Act failed to pass
The Senate procedural vote failed to pass the (CLARITY Act) by 49 votes in favor and 50 against. It still fell short of the 60-vote threshold needed to move to the next stage by 11 votes. After the bill failed, Bitcoin briefly dipped to $74,900, down about 4% on the day.
The Fed’s rate hike takes effect, with a clearly hawkish stance
The Federal Reserve announced it would raise the federal funds rate to 3.75%-4.00%, the first rate hike since 2023. All 12 committee members voted in favor. The new chair, Kevin Warsh, made it clear that "inflation is too high and has persisted for too long, and the inflation data this summer has not shown that underlying trends have improved materially." More importantly, the Fed’s latest projections show that among 18 policymakers, 16 expect at least another 25-basis-point rate hike by the end of 2026.
After the rate hike is finalized, Bitcoin first fell then stabilized. Within the first hour after the decision was released, it briefly dropped to $75,355, then rebounded to around $75,813. It has fallen nearly 4% on the week.
Liquidity conditions: ETF outflows vs. institutional observation
US spot Bitcoin ETFs recorded approximately $450 million in net outflows; Ethereum ETFs also saw significant capital outflows. In the past 24 hours, the crypto market saw $455 million worth of leveraged positions liquidated. Bitget Wallet research analysts noted that the bill failing to advance is indeed a major negative specific to the crypto market. But even before the Senate vote, Bitcoin had already been under multiple pressures, including ETF investors getting trapped, cooling retail demand, and liquidity tightening.
🔗 On-chain data: short-term holders stop out and exit
On-chain data shows that the amount of Bitcoin transferred to exchanges by short-term holders surged from about 19.4k BTC to 33.1k BTC, of which about 23.2k BTC is in unrealized losses. This is the largest stop-loss-style selling by short-term holders in the past month.
From the exchange distribution: Kraken’s inflow volume exceeded 6,000 BTC, significantly higher than the usual 2,000–3,000 BTC; Binance’s inflow exceeded 10,000 BTC; Coinbase Advanced’s inflow is about 7,300 BTC.
However, this round of sell pressure does not come from an exit by all coin holders at the same time. The sell orders are mainly concentrated among investors who bought recently. Long-term holders remain relatively stable, which sharply contrasts with the panic stop-loss selling of short-term holders.
⚡ Liquidation map: Short pile-up overhead—hidden risk of a short squeeze
Coinglass liquidation heatmap shows that current BTC is in a severely piled-up short position:
Above: In the $75,982 to $83,575 range, the cumulative short liquidation pressure is as high as $479 million, about 2.5 times the long liquidation size below.
Below: In the range from below $75,000 to $67,861, the cumulative long liquidation size is $205 million.
In the past 24 hours, the long positions liquidated totaled $174 million, while short liquidation was only $37.9 million. This shows that some traders continued adding shorts after the sharp drop.
This means that once a Bitcoin rebound enters the area where shorts are densely distributed (75,982–83,575), it may trigger a chain of forced closures. Passive buy orders could further amplify the upside move. The liquidation map reflects the potential liquidation magnitude. A concentrated short positioning alone is not enough to directly prove a reversal, but the structural asymmetry is worth a high level of caution.
📋 Trading reference (for reference only, not investment advice)
More-leaning plan (oversold repair + short-squeeze expectations):
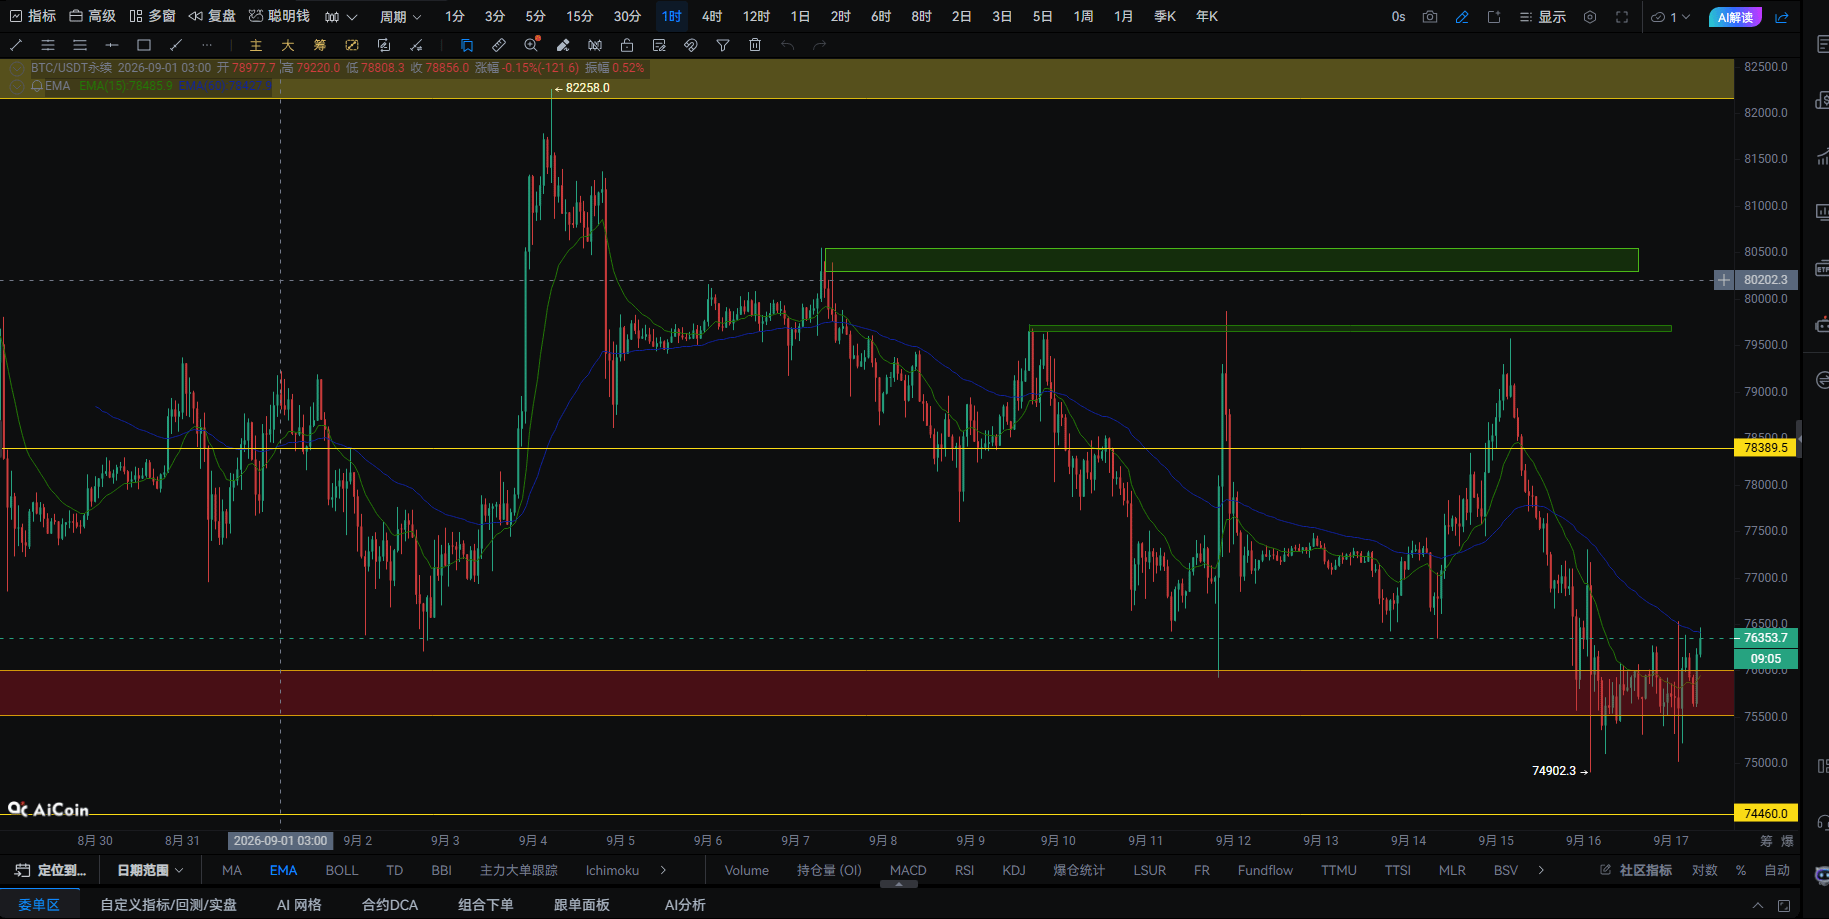
Entry reference: Pull back to 74,900–75,200 to find stability and try a small long position, or follow through after a valid breakout above 76,589.
Stop loss: Below 74,460 (4-hour yellow line).
Targets: First target 76,589–76,680. After holding above it, look at 78,389, and further at 80,000+ (the short liquidation trigger zone).
Bear-leaning plan (trend-following):
Entry reference: If price rebounds into the 76,589–76,680 moving-average band and meets resistance, try a small short position.
Stop loss: Above 78,389.
Targets: 74,902 → 74,460 → 73,500.
Current status: 76,359 is below the short-term moving averages and above the 4-hour support, making it a bottoming-and-stagnation phase at low levels after macro negative news is priced in. The room to chase shorts is limited (not far from the 74,460 support). Chasing longs needs to wait for a moving-average repair signal. 74,902 is the key level to watch: if it holds, a short-term bottom may form; if it breaks, it will most likely test 74,460 and possibly 73,500.
💎 Core takeaway
In the short term, focus on the macro picture; in the medium term, focus on the liquidation structure. The failure of the CLARITY Act + the Fed’s hawkish rate hikes: in the short term, sentiment is indeed bearish. However, the short liquidation pressure of $4.79 billion above and the long liquidation size of only $2.05 billion below create a clear asymmetry. When the market is unanimously bearish, it is often the eve of a reversal. The current price 76,359 is squeezed between the short-term moving averages (bearish) and the 4-hour support (bullish). The reversal window is narrowing. Pay close attention to a breakout above 76,589 and how support at 74,902 holds up.
#BTC走势分析 #美联储会议 #CLARITY法案 #比特币ETF净流出4.5亿美元 $ETH $BTC

