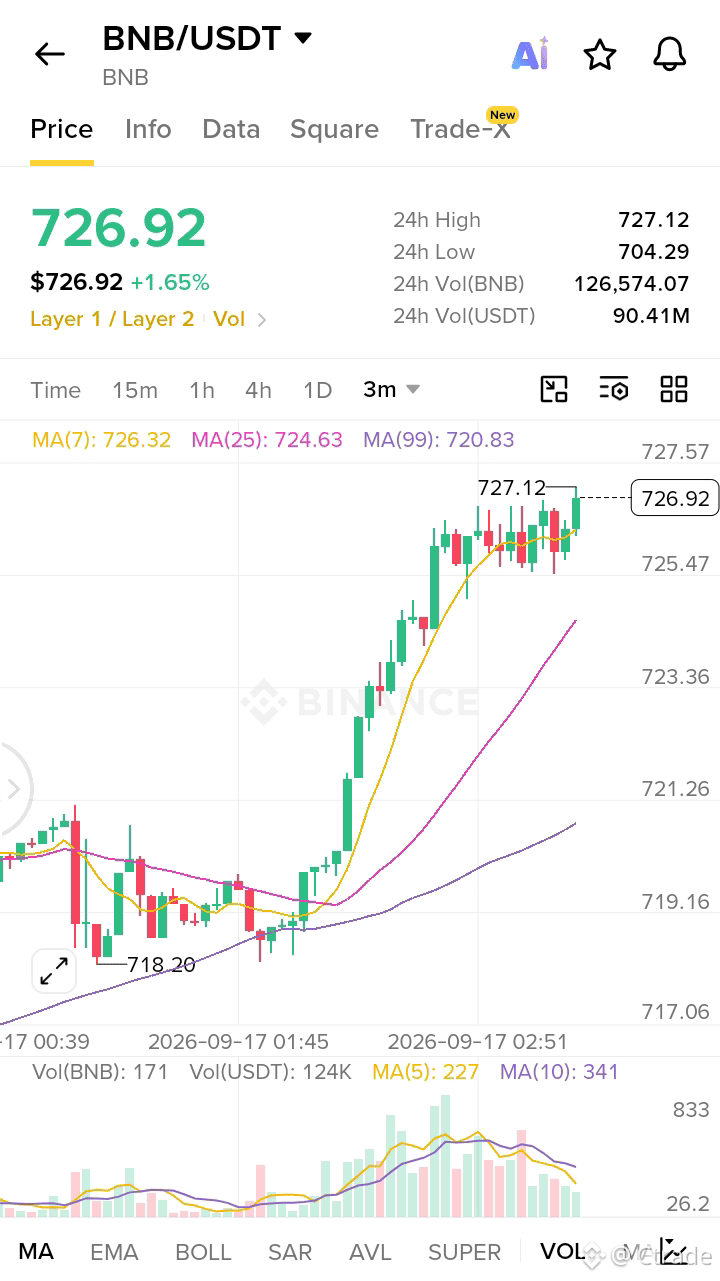
$BNB BNB technical indicators — 1D
BNB is $726.28 as of 2026-09-17, up +0.05% versus the previous daily close. It is trading just under today’s high of $726.87.
RSI(6): 54.10 — neutral. Momentum is balanced rather than in an overbought or oversold zone.
MACD(12,26,9): bearish. DIF is 15.54, below DEA at 20.26; the latest death cross occurred 7 daily bars ago. The histogram is still negative (-4.73) but less negative than the previous reading (-5.14), suggesting bearish momentum has eased somewhat rather than intensified.
Moving averages: Price is above the MA(7) $722.20, MA(25) $715.80, and MA(99) $621.11. The alignment is bullish, with short- and medium-term averages above the longer-term average.
SuperTrend(10, 3.0): uptrend, with its reading at $676.94.
Range context: BNB is -2.07% below the 7-day high of $741.61 and -6.96% below the 30-day high of $780.64. It remains +21.05% above the 30-day low of $600.00.
Volume and flows: Today’s volume is 1,990 BNB, only 0.02× the 7-day average because the daily candle is still in progress. Daily large-order flow is marginally positive, at +82.69 BNB net inflow (+0.06%).
Overall, trend measures remain constructive, while MACD still reflects short-term bearish momentum from the recent pullback. The current daily candle’s low volume means intraday indicator changes should be treated cautiously.$BNB #BNB
BNB is $726.28 as of 2026-09-17, up +0.05% versus the previous daily close. It is trading just under today’s high of $726.87.
RSI(6): 54.10 — neutral. Momentum is balanced rather than in an overbought or oversold zone.
MACD(12,26,9): bearish. DIF is 15.54, below DEA at 20.26; the latest death cross occurred 7 daily bars ago. The histogram is still negative (-4.73) but less negative than the previous reading (-5.14), suggesting bearish momentum has eased somewhat rather than intensified.
Moving averages: Price is above the MA(7) $722.20, MA(25) $715.80, and MA(99) $621.11. The alignment is bullish, with short- and medium-term averages above the longer-term average.
SuperTrend(10, 3.0): uptrend, with its reading at $676.94.
Range context: BNB is -2.07% below the 7-day high of $741.61 and -6.96% below the 30-day high of $780.64. It remains +21.05% above the 30-day low of $600.00.
Volume and flows: Today’s volume is 1,990 BNB, only 0.02× the 7-day average because the daily candle is still in progress. Daily large-order flow is marginally positive, at +82.69 BNB net inflow (+0.06%).
Overall, trend measures remain constructive, while MACD still reflects short-term bearish momentum from the recent pullback. The current daily candle’s low volume means intraday indicator changes should be treated cautiously.$BNB #BNB