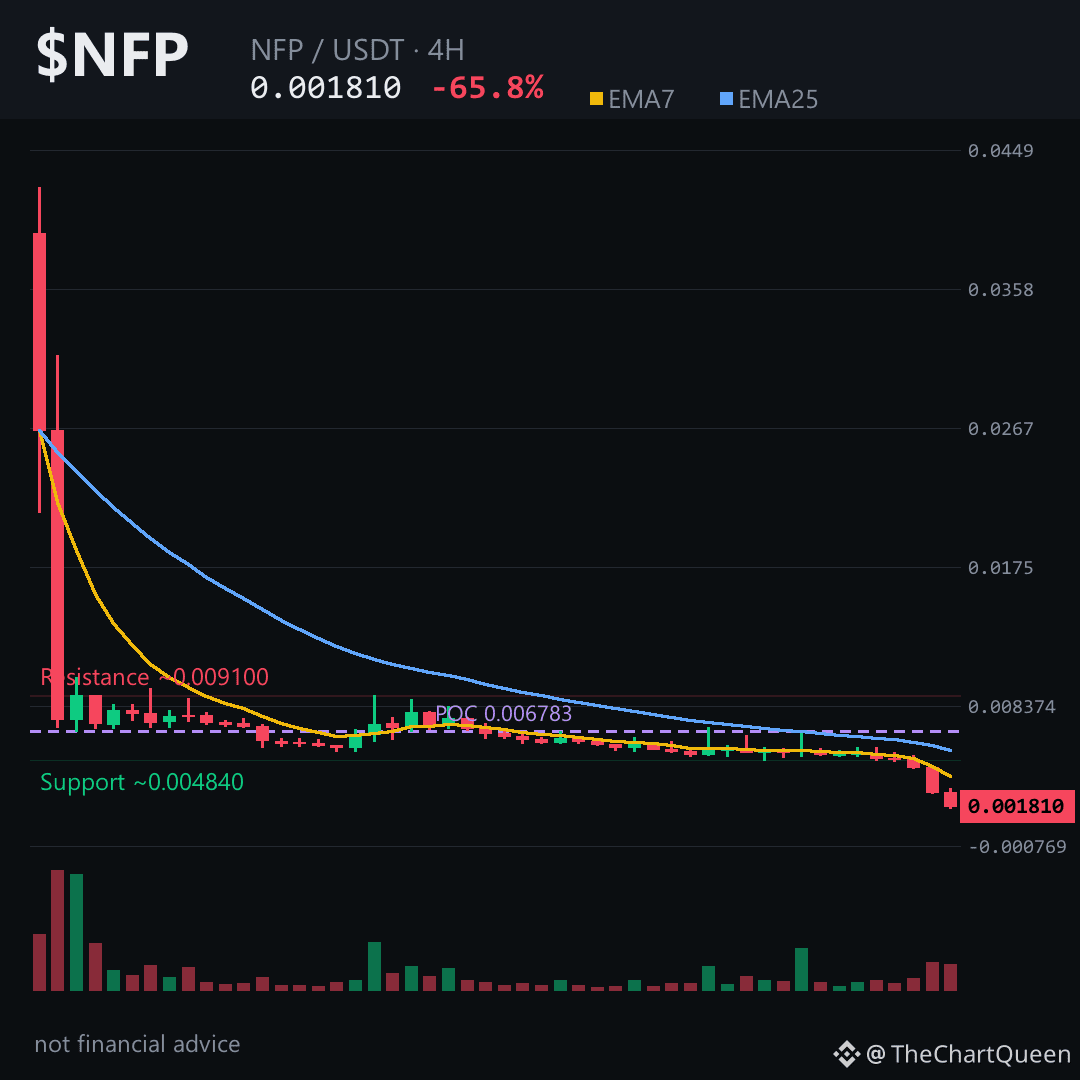
Why is $NFP slipping through the 0.0018 zone like a stone in a stream? Read on before you dismiss the hidden trap 👇
Price is crumbling under a bearish EMA crossover and an RSI stuck in the single digits, but the 4‑hour chart still holds a tiny demand pocket that could catch a bounce. The bearish unfilled gap just below 0.0045 adds pressure, suggesting the downside may keep digging.
If $NFP drops below the ~0.00191 barrier on a 4‑hour close, the bearish case is confirmed; the next target sits near the ~0.00166 zone, while the current area around ~0.00182 acts as the last line of support. Tap $NFP to pull up the chart and see these zones yourself.
My read is that the market is likely to test the ~0.00191 level before any meaningful recovery, so the real risk lies in a break beneath that zone.
I’ll break down what a move through the ~0.00191 barrier means for the next swing, so hit follow to stay ahead. What level do you think will hold the most pressure on NFP? 👇
⚠️ Not financial advice. DYOR.
#NFP #Crypto #BinanceSquare #TopLoser
Price is crumbling under a bearish EMA crossover and an RSI stuck in the single digits, but the 4‑hour chart still holds a tiny demand pocket that could catch a bounce. The bearish unfilled gap just below 0.0045 adds pressure, suggesting the downside may keep digging.
If $NFP drops below the ~0.00191 barrier on a 4‑hour close, the bearish case is confirmed; the next target sits near the ~0.00166 zone, while the current area around ~0.00182 acts as the last line of support. Tap $NFP to pull up the chart and see these zones yourself.
My read is that the market is likely to test the ~0.00191 level before any meaningful recovery, so the real risk lies in a break beneath that zone.
I’ll break down what a move through the ~0.00191 barrier means for the next swing, so hit follow to stay ahead. What level do you think will hold the most pressure on NFP? 👇
⚠️ Not financial advice. DYOR.
#NFP #Crypto #BinanceSquare #TopLoser