Trading Thesis|9/17 01:21
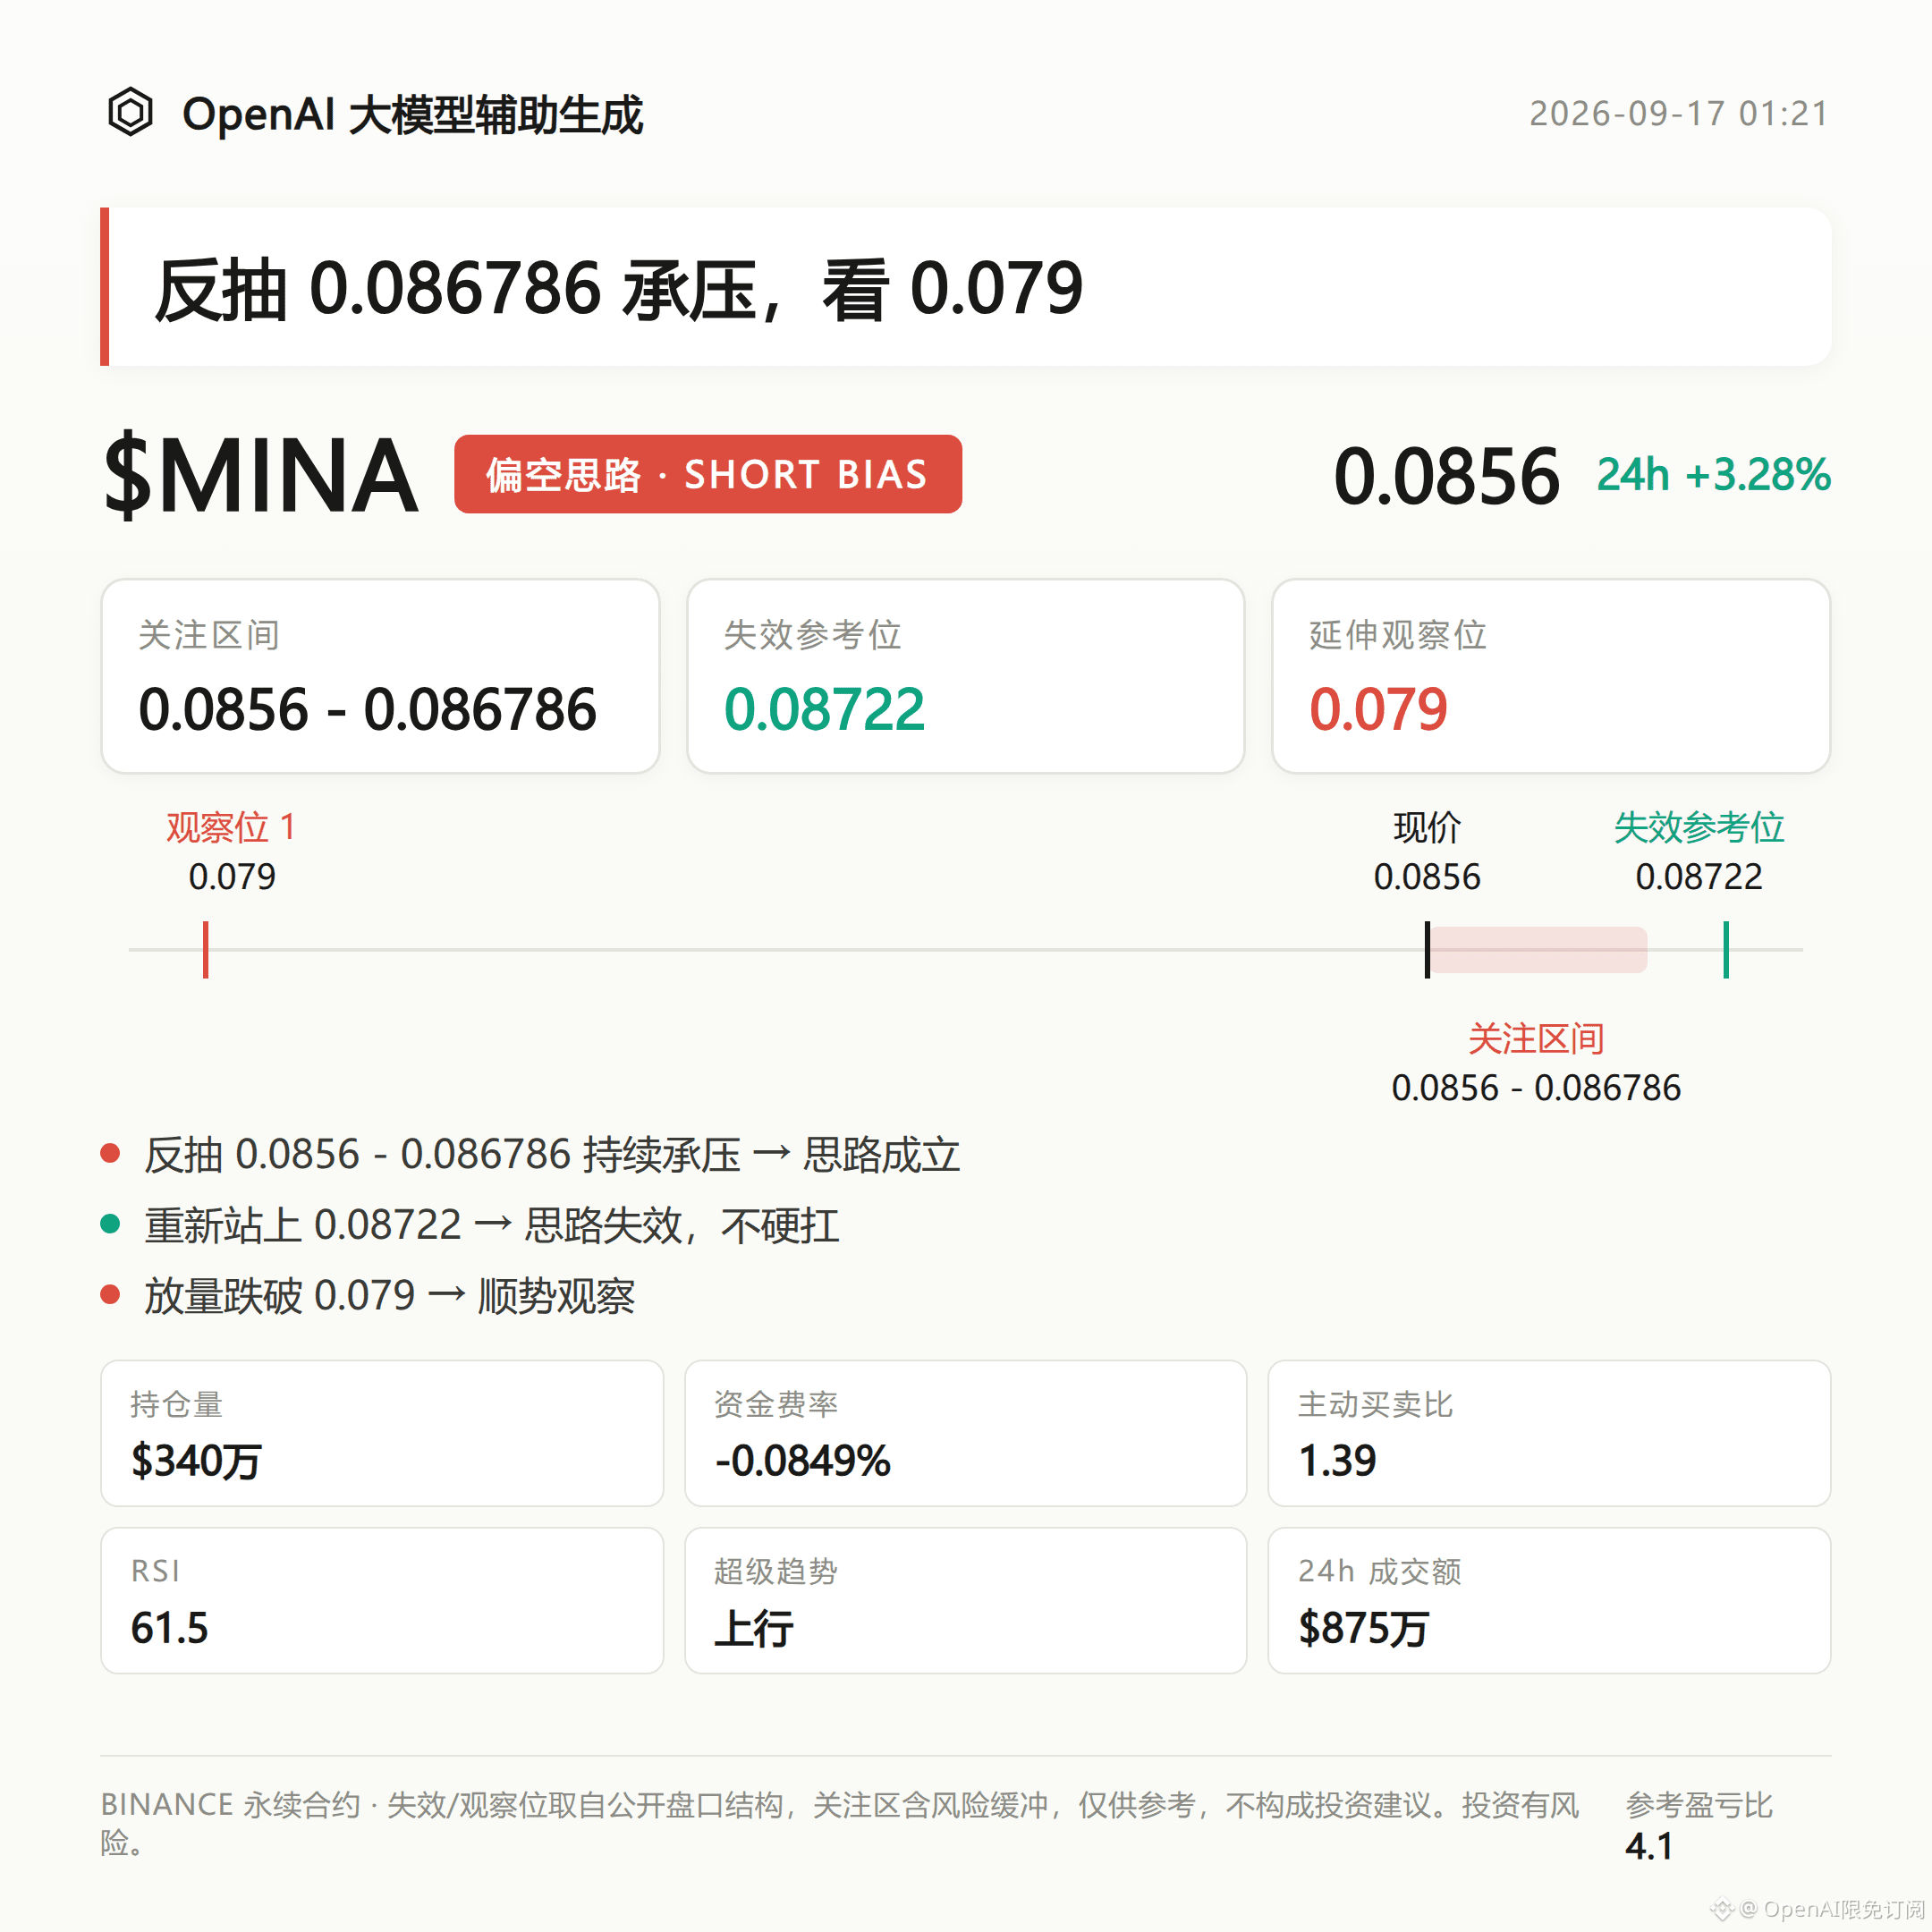
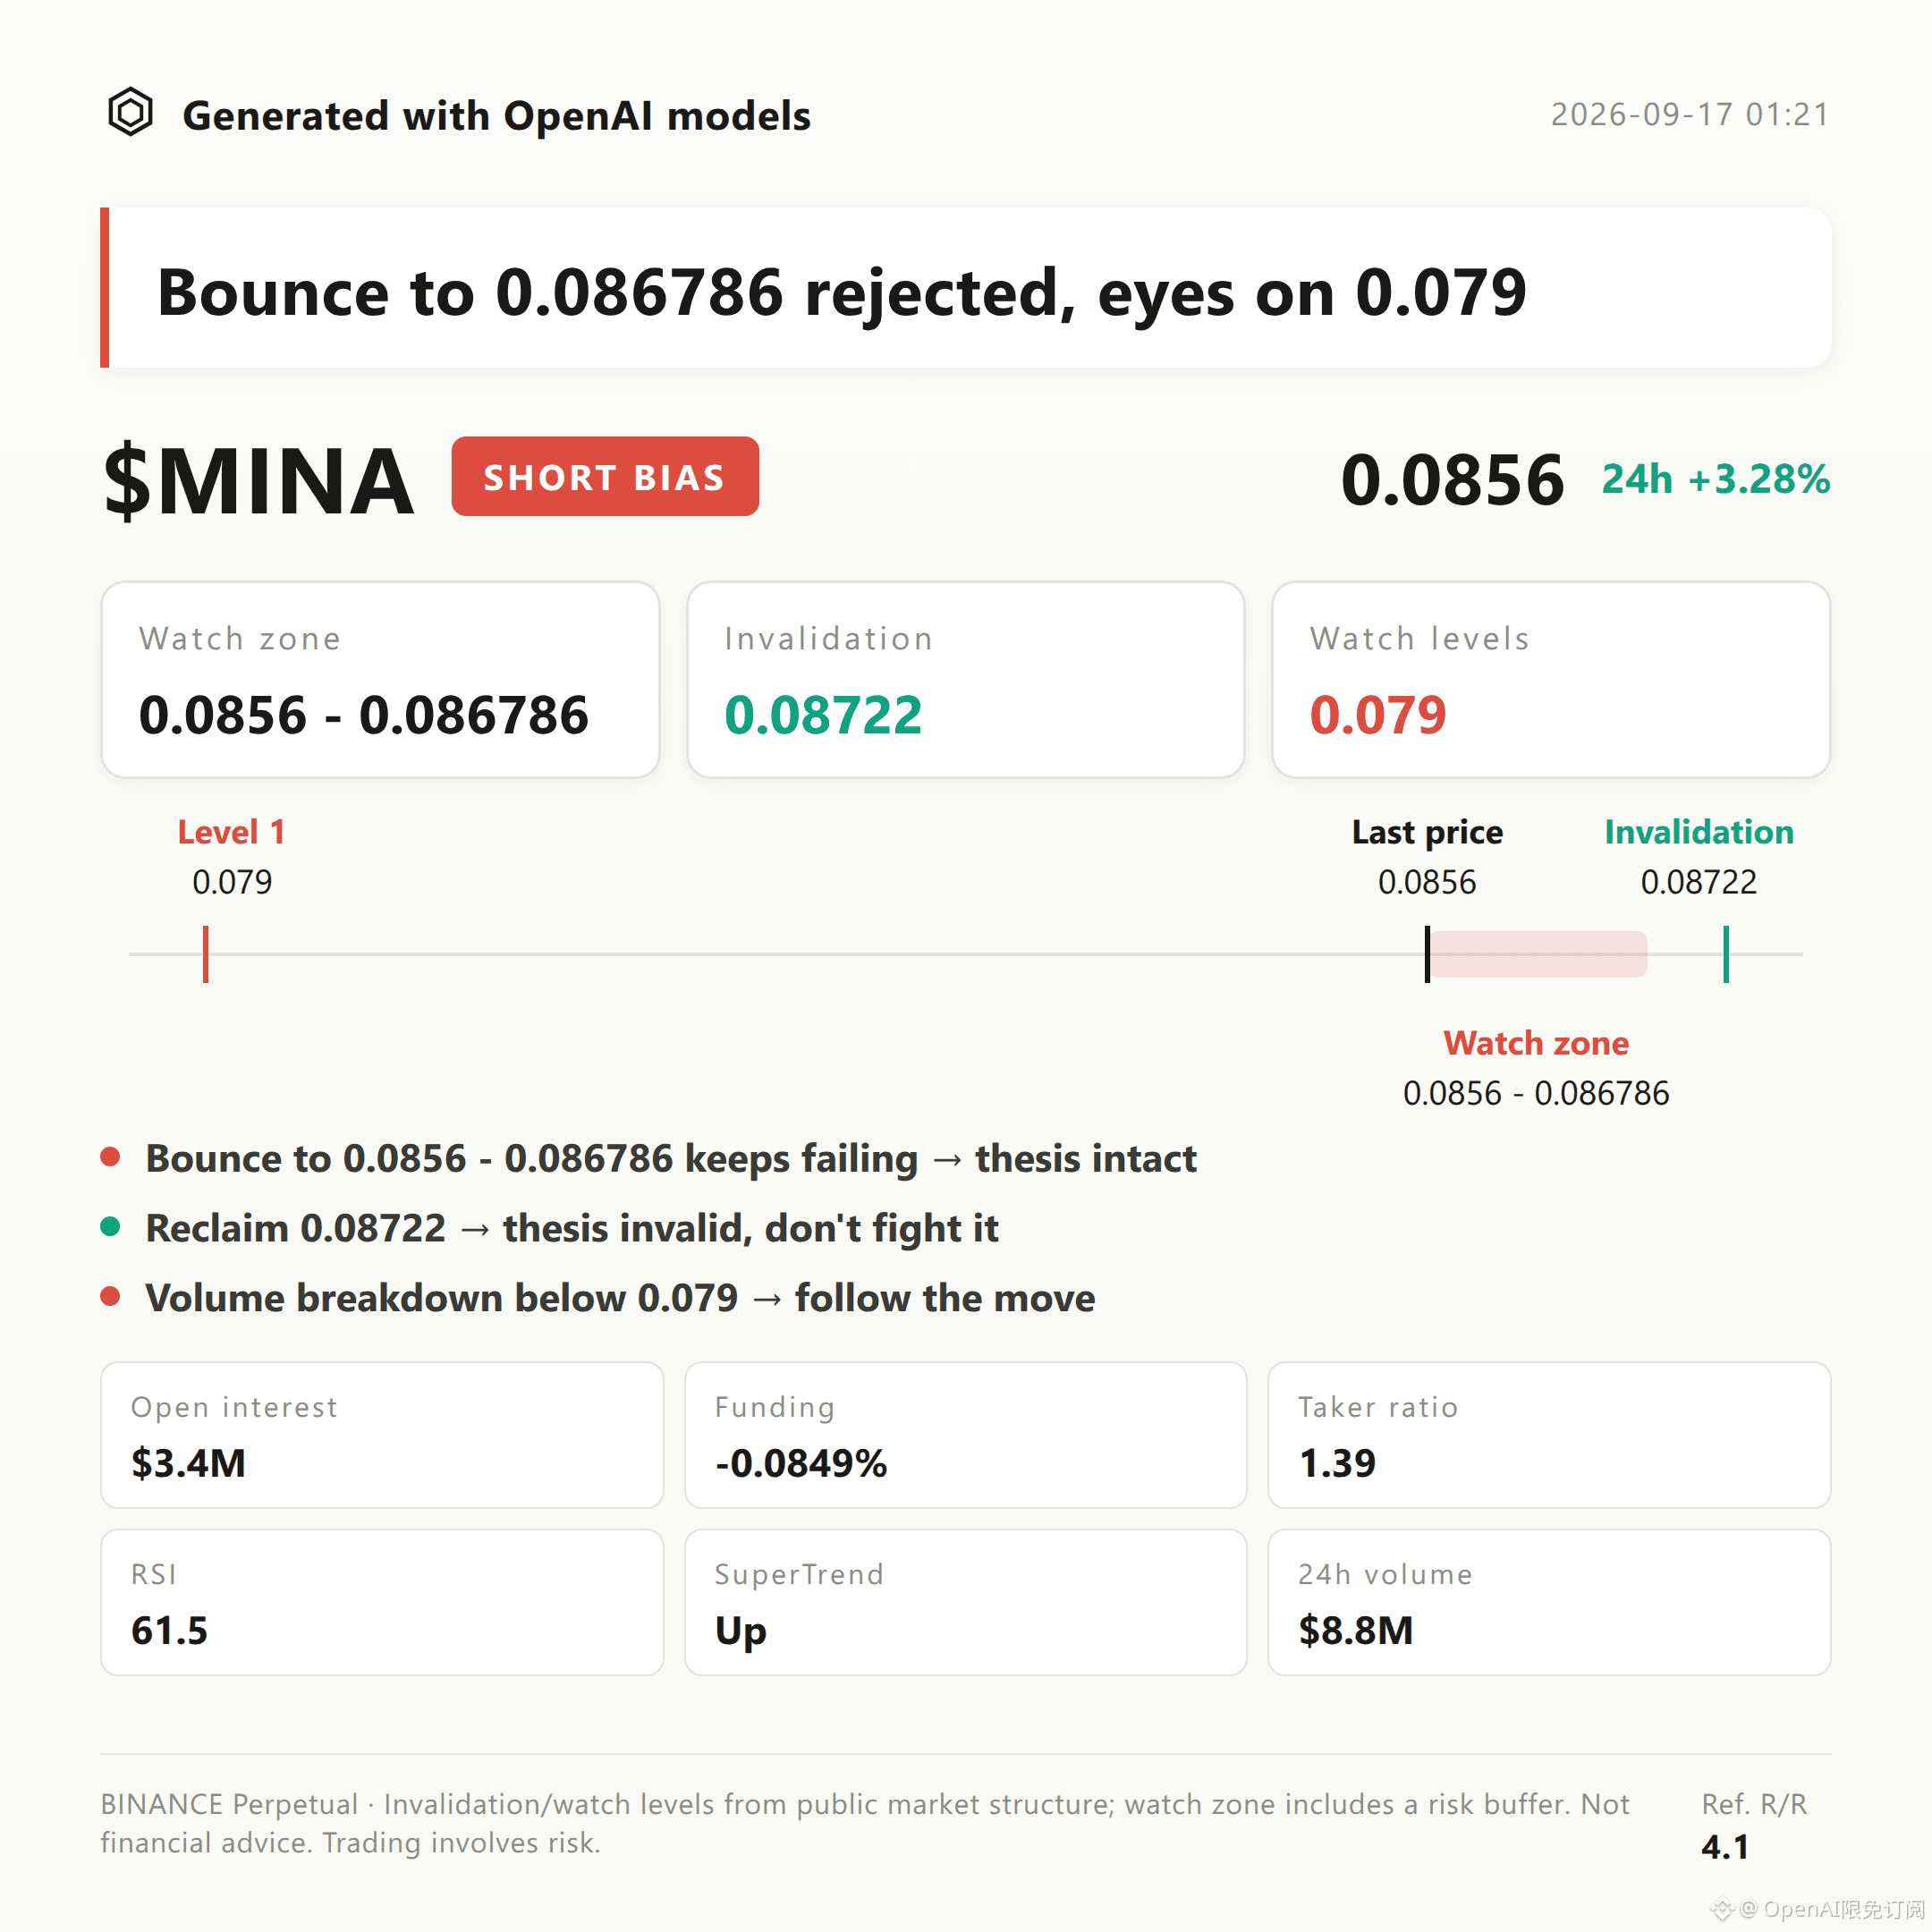
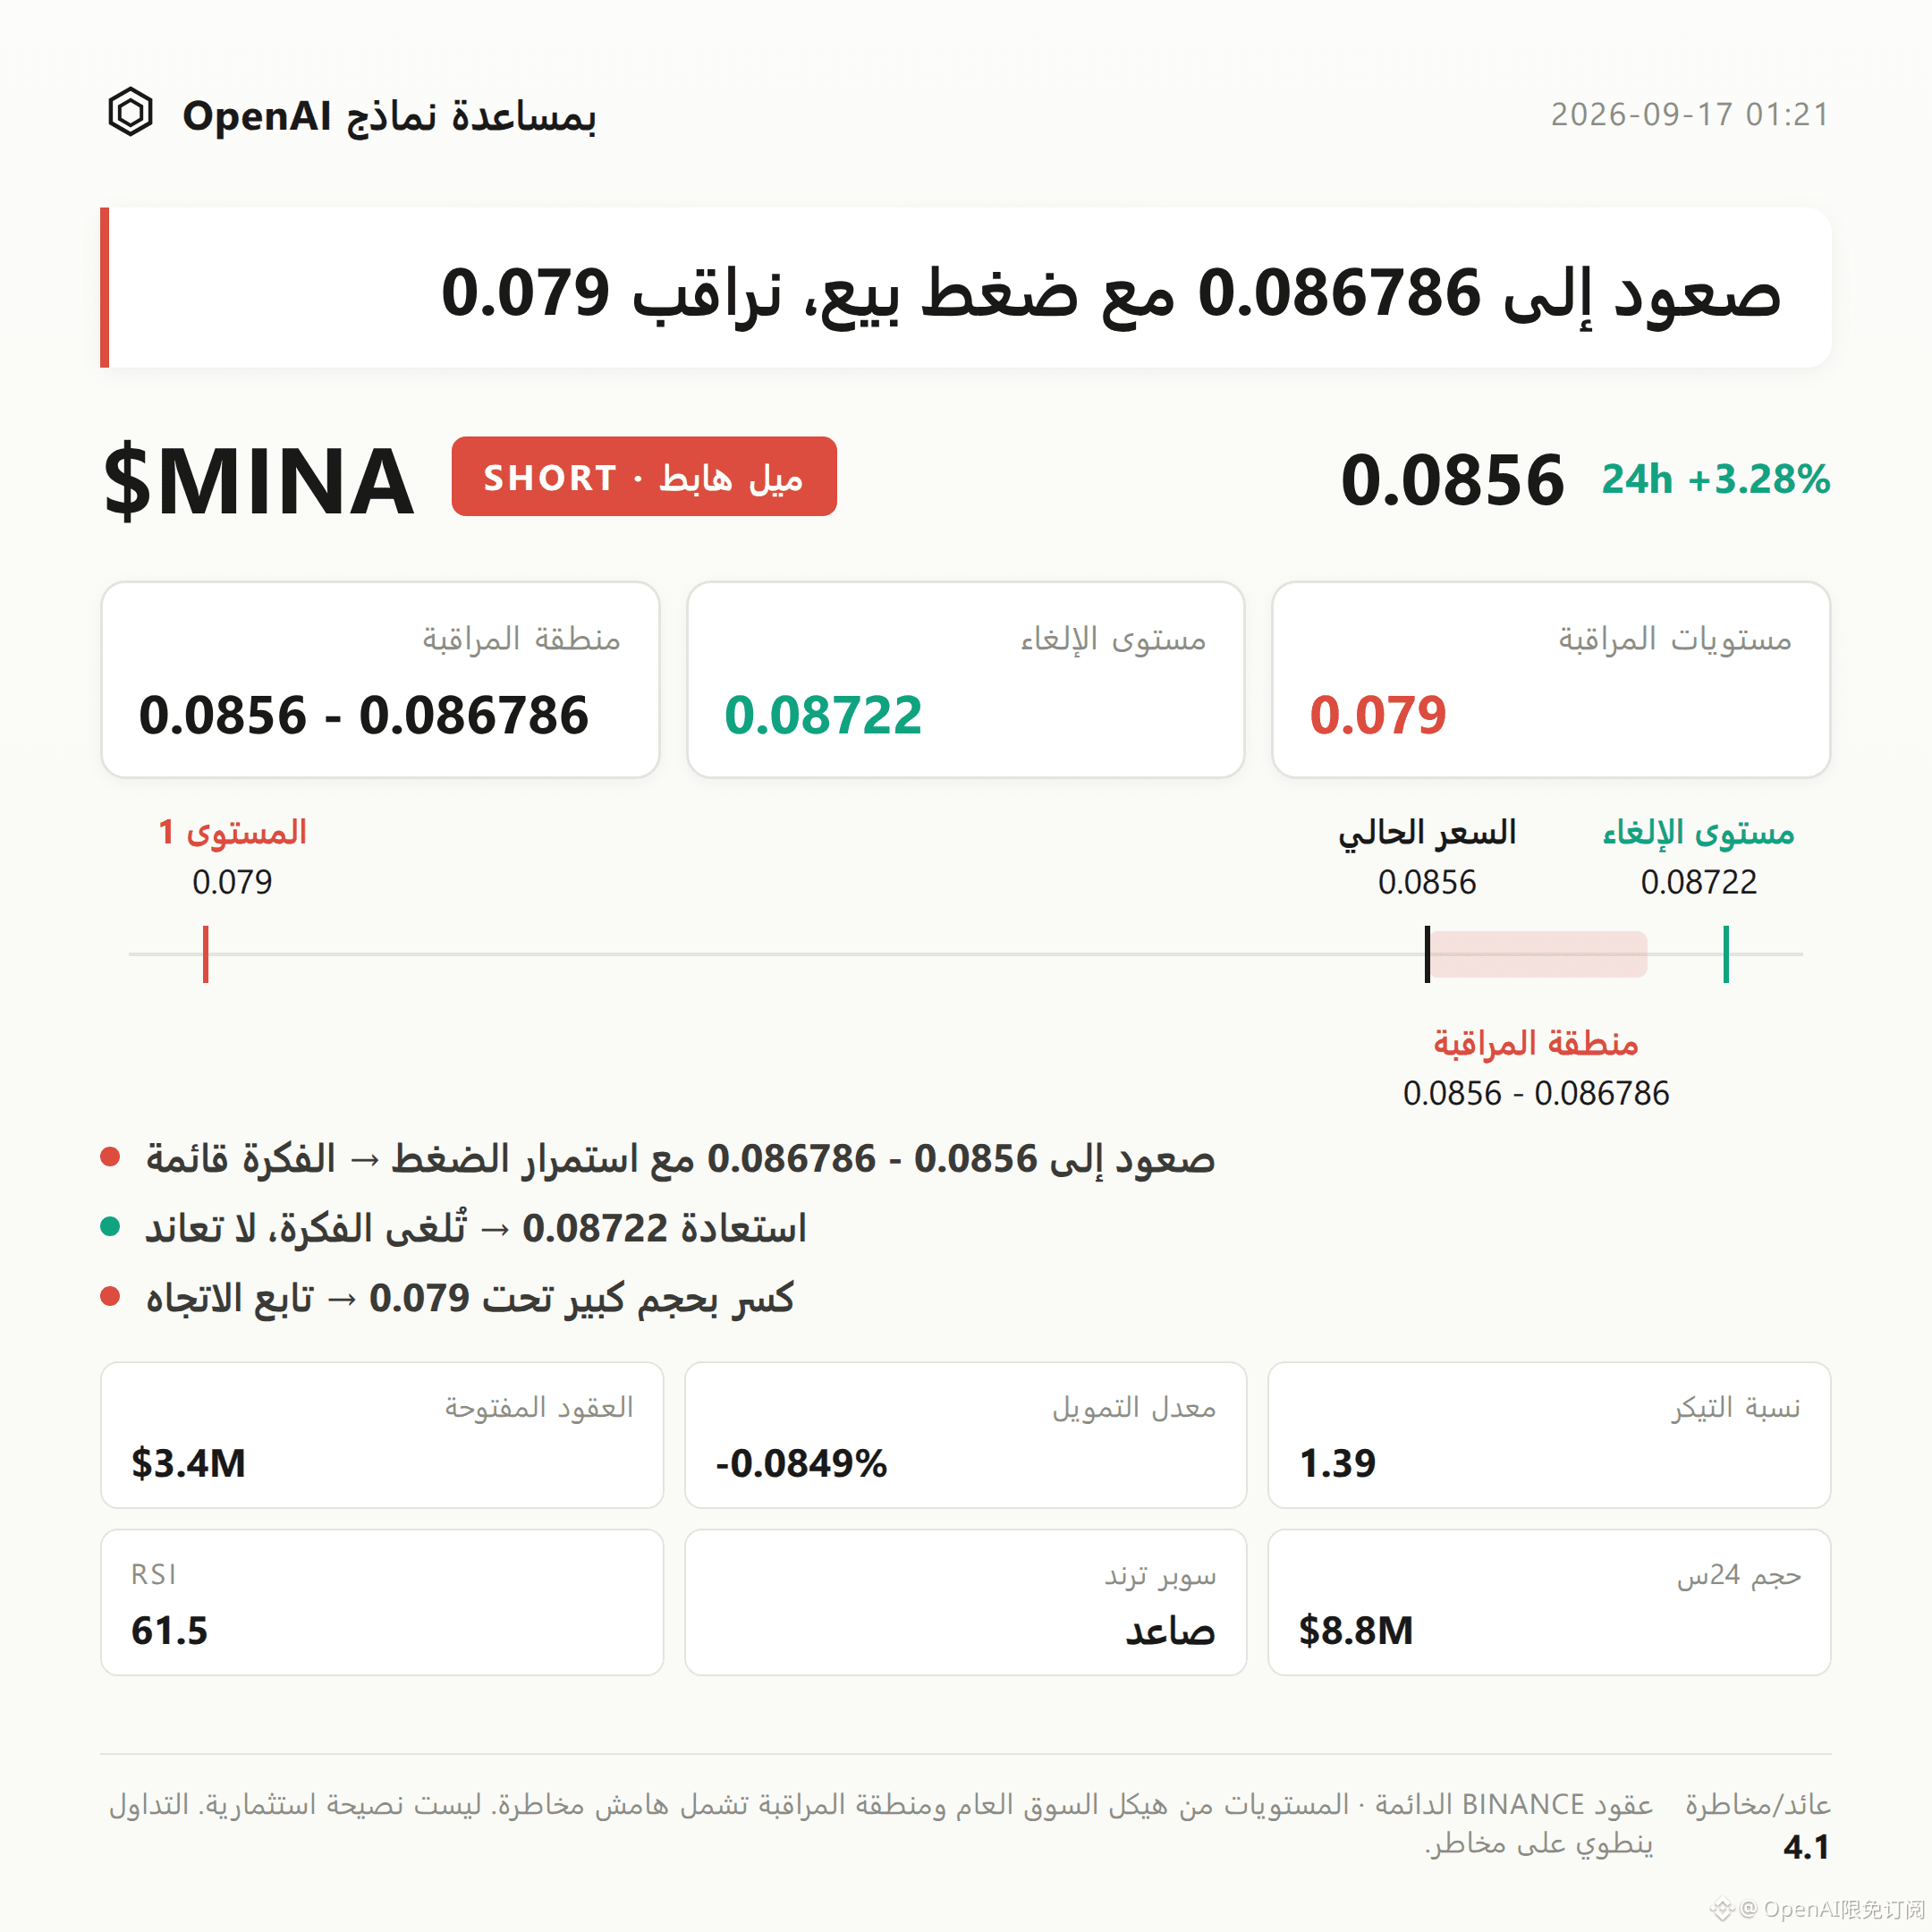
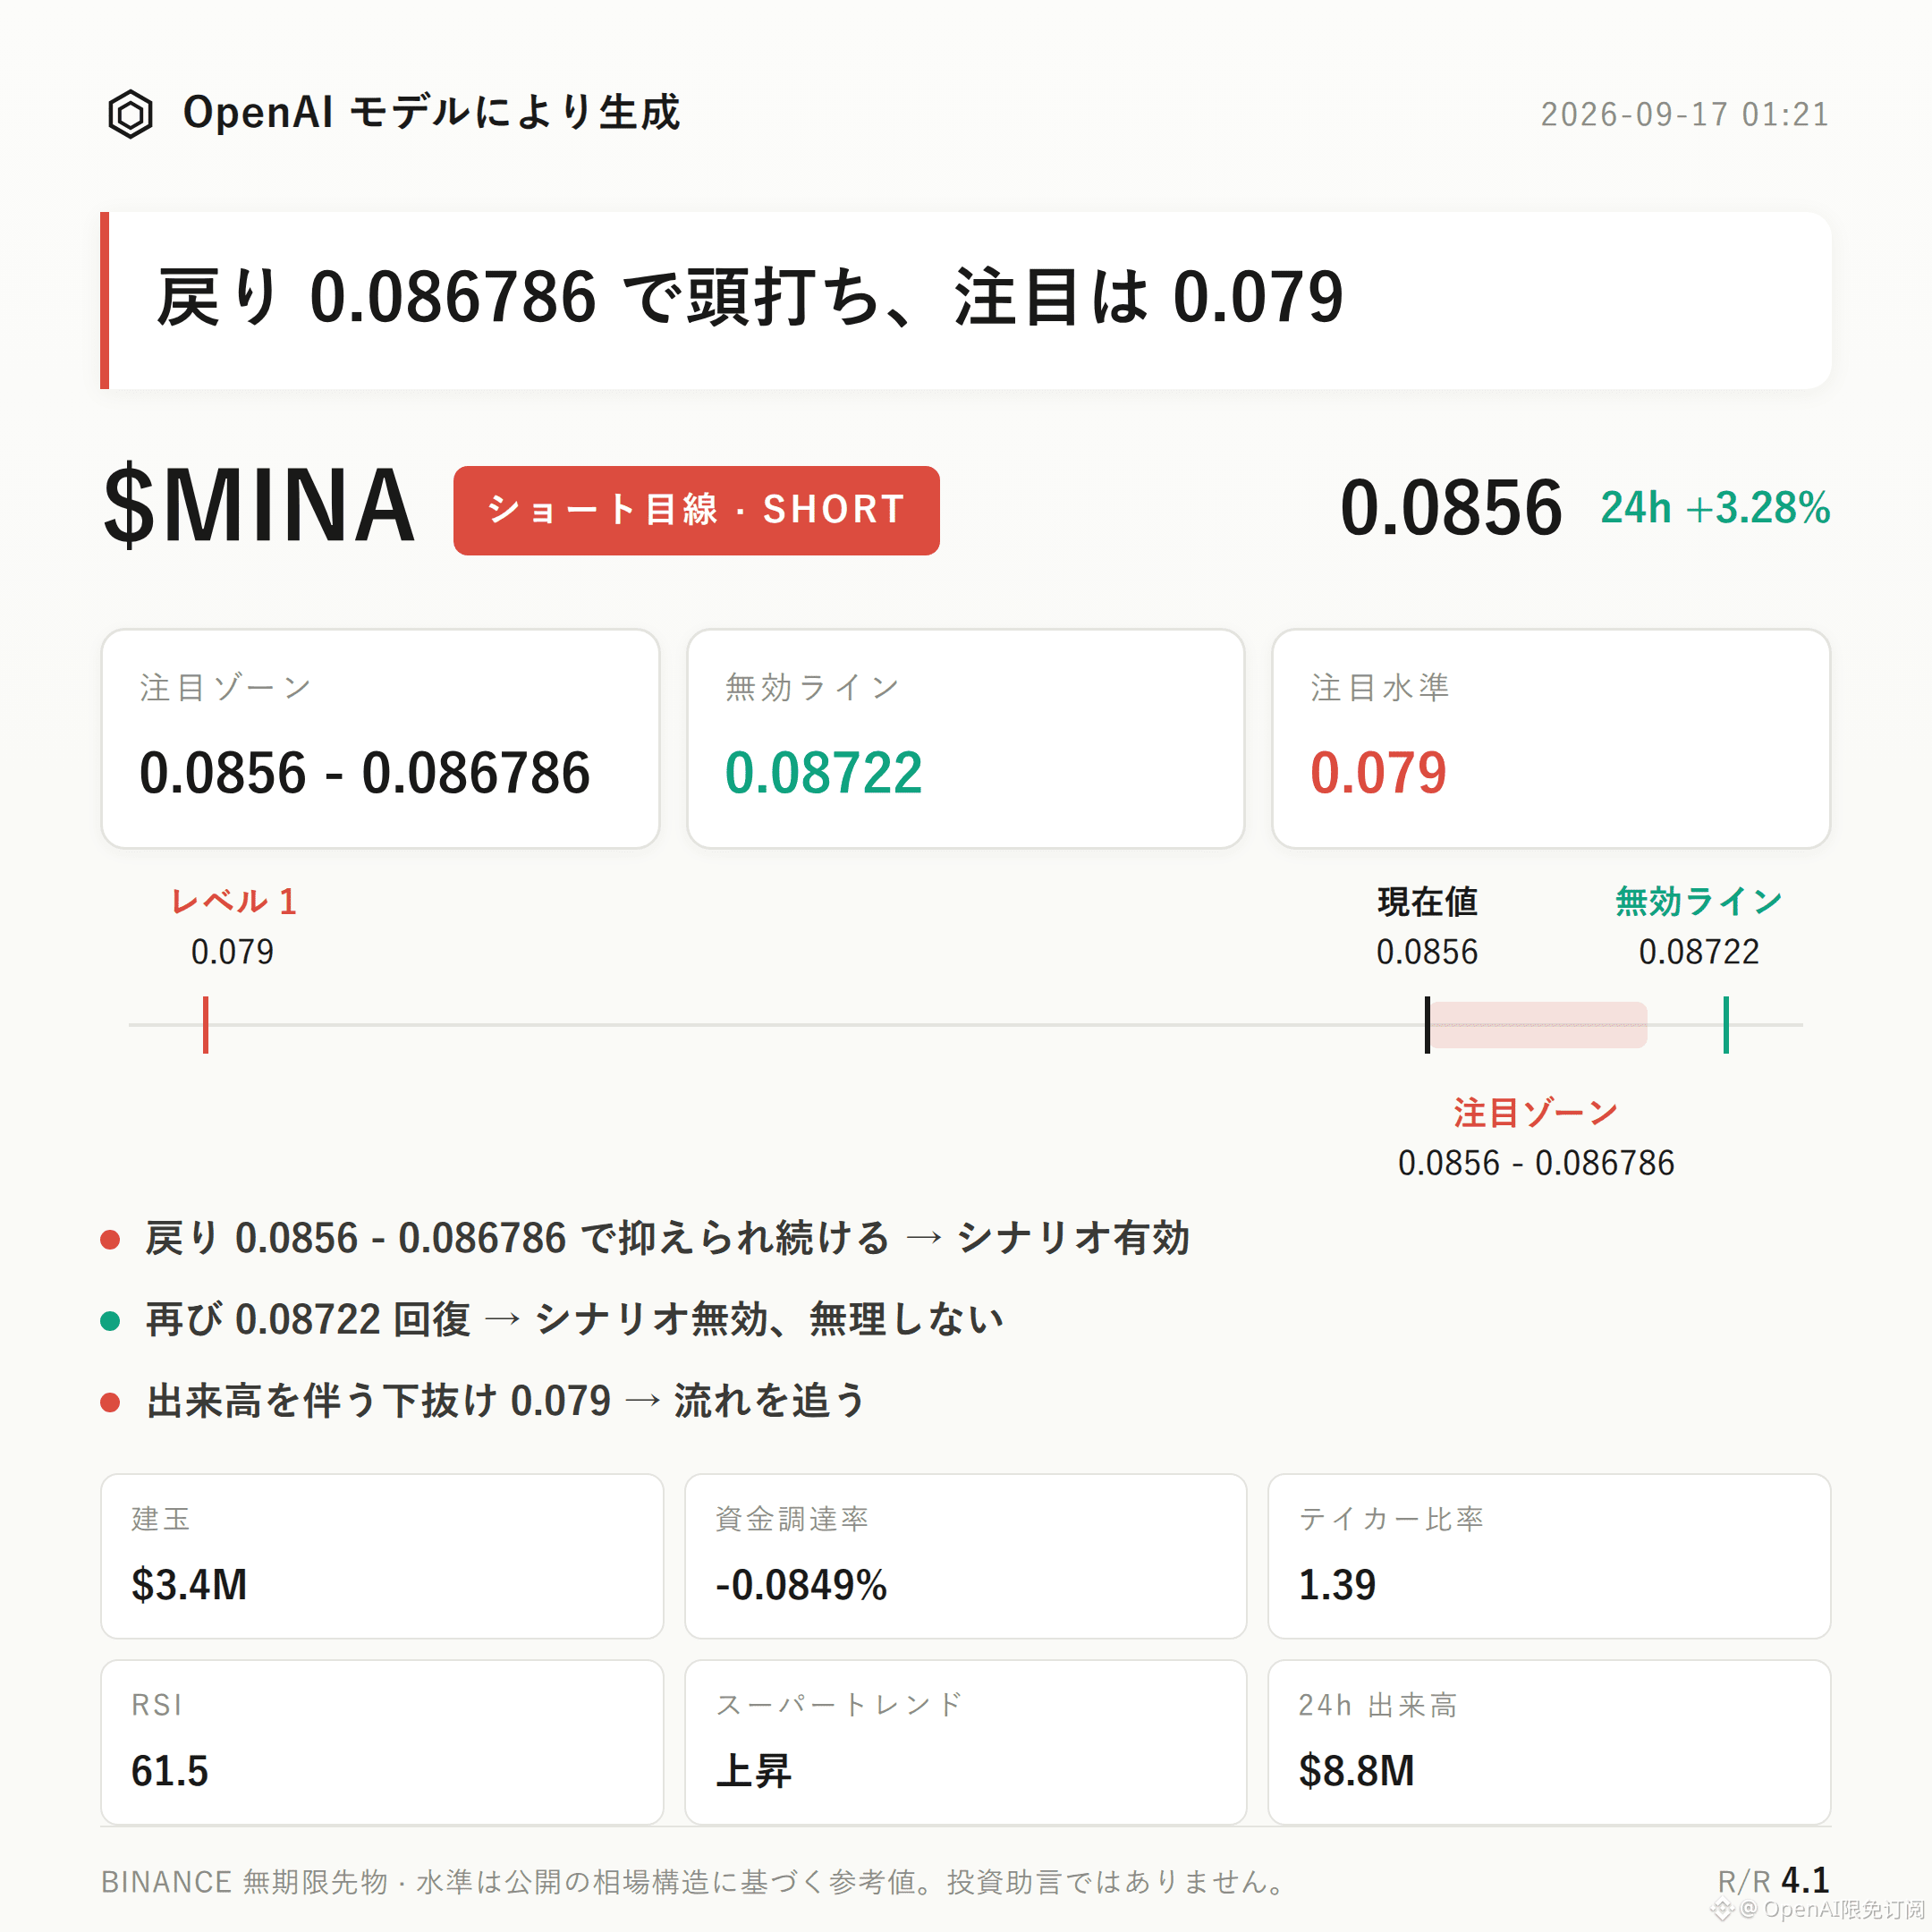
$MINA bearish-leaning outlook | Watch Zone 0.0856 - 0.086786 | Invalidation Reference 0.08722 | Observation Level 0.079
$MINA ’s current structure is leaning bearish.
The core arguments look at three points:
1) Price has already touched the upper Bollinger Band around 0.0856.
2) The 24-hour trading volume has decreased by 10%, indicating that leveraged capital is withdrawing.
3) The funding rate has turned negative to -0.0849%; even under a state where shorts pay, the price still has not effectively broken the previous high.
Next, the focus is whether a pullback can be capped in the resistance zone—not to jump to conclusions based solely on the current price location.
Technically, the recent high is 0.08722, the recent low is 0.079. The current price of 0.0856 is right near the upper Bollinger Band (Upper Band 0.0856 / Middle Band 0.0823 / Lower Band 0.079).
The Supertrend indicator is still marked as pointing upward, RSI is 61.5—sitting in a neutral-to-strong range rather than overbought. MACD shows bullish momentum. These indicators themselves do not support a bearish bias and must be stated accurately.
The bearish emphasis is more on whether momentum can continue after price hits the upper-band resistance zone, rather than relying on the fact that trend indicators have already started to weaken.
From a derivatives perspective, 24-hour trading value is $8.75 million. Open interest is $3.4 million and is down 10% over the past 24 hours, meaning leveraged participation is shrinking.
Funding rate is -0.0849%, so the shorts side is paying. The long/short account ratio shows long accounts at 42% (i.e., shorts account for the majority). But price is still in the recent high range. In such a structure, you need to watch for squeeze risk.
The active buy/sell ratio is 1.39, indicating buy-side aggressiveness that is clearly stronger—this is evidence that conflicts with a bearish thesis and must be disclosed honestly; it cannot be ignored or avoided.
On levels: for shorts, the focus is the bearish watch zone—start with 0.0856 to 0.086786. It is more suitable to wait for confirmation after a pullback and rejection, rather than drawing bearish conclusions immediately just because price is near.
If price retraces into that range and shows signs of stall (or fails to strengthen with volume), then the bearish structure can continue to be monitored under the original thesis.
Place the invalidation reference at 0.08722. If price rises again and effectively holds above it, that means the current pullback structure is broken; the bearish thesis should be considered invalid and you should not continue to “fight” the move.
For the lower extended observation level, watch 0.079. If price further dips toward there, you need to observe the strength of the support/acceptance—not assume it will break down directly. This is still only an observation level.
The reference risk/reward ratio is 4.1, used only to gauge structural symmetry and does not imply it will unfold exactly that way.
Need to stress again: active buy/sell ratio of 1.39, RSI not being overbought, MACD bullish momentum, and Supertrend still pointing upward—these are all counter-evidence to the bearish thesis and represent the biggest risk point of this post; they should not be overlooked.
With contract leverage, position discipline matters more than directional judgement.
For reference only and does not constitute investment advice. Contracts involve leverage; investing involves risk.
This article was generated with the assistance of an OpenAI large model.
$MINA
#Contract Analysis
$MINA bearish-leaning outlook | Watch Zone 0.0856 - 0.086786 | Invalidation Reference 0.08722 | Observation Level 0.079
$MINA ’s current structure is leaning bearish.
The core arguments look at three points:
1) Price has already touched the upper Bollinger Band around 0.0856.
2) The 24-hour trading volume has decreased by 10%, indicating that leveraged capital is withdrawing.
3) The funding rate has turned negative to -0.0849%; even under a state where shorts pay, the price still has not effectively broken the previous high.
Next, the focus is whether a pullback can be capped in the resistance zone—not to jump to conclusions based solely on the current price location.
Technically, the recent high is 0.08722, the recent low is 0.079. The current price of 0.0856 is right near the upper Bollinger Band (Upper Band 0.0856 / Middle Band 0.0823 / Lower Band 0.079).
The Supertrend indicator is still marked as pointing upward, RSI is 61.5—sitting in a neutral-to-strong range rather than overbought. MACD shows bullish momentum. These indicators themselves do not support a bearish bias and must be stated accurately.
The bearish emphasis is more on whether momentum can continue after price hits the upper-band resistance zone, rather than relying on the fact that trend indicators have already started to weaken.
From a derivatives perspective, 24-hour trading value is $8.75 million. Open interest is $3.4 million and is down 10% over the past 24 hours, meaning leveraged participation is shrinking.
Funding rate is -0.0849%, so the shorts side is paying. The long/short account ratio shows long accounts at 42% (i.e., shorts account for the majority). But price is still in the recent high range. In such a structure, you need to watch for squeeze risk.
The active buy/sell ratio is 1.39, indicating buy-side aggressiveness that is clearly stronger—this is evidence that conflicts with a bearish thesis and must be disclosed honestly; it cannot be ignored or avoided.
On levels: for shorts, the focus is the bearish watch zone—start with 0.0856 to 0.086786. It is more suitable to wait for confirmation after a pullback and rejection, rather than drawing bearish conclusions immediately just because price is near.
If price retraces into that range and shows signs of stall (or fails to strengthen with volume), then the bearish structure can continue to be monitored under the original thesis.
Place the invalidation reference at 0.08722. If price rises again and effectively holds above it, that means the current pullback structure is broken; the bearish thesis should be considered invalid and you should not continue to “fight” the move.
For the lower extended observation level, watch 0.079. If price further dips toward there, you need to observe the strength of the support/acceptance—not assume it will break down directly. This is still only an observation level.
The reference risk/reward ratio is 4.1, used only to gauge structural symmetry and does not imply it will unfold exactly that way.
Need to stress again: active buy/sell ratio of 1.39, RSI not being overbought, MACD bullish momentum, and Supertrend still pointing upward—these are all counter-evidence to the bearish thesis and represent the biggest risk point of this post; they should not be overlooked.
With contract leverage, position discipline matters more than directional judgement.
For reference only and does not constitute investment advice. Contracts involve leverage; investing involves risk.
This article was generated with the assistance of an OpenAI large model.
$MINA
#Contract Analysis