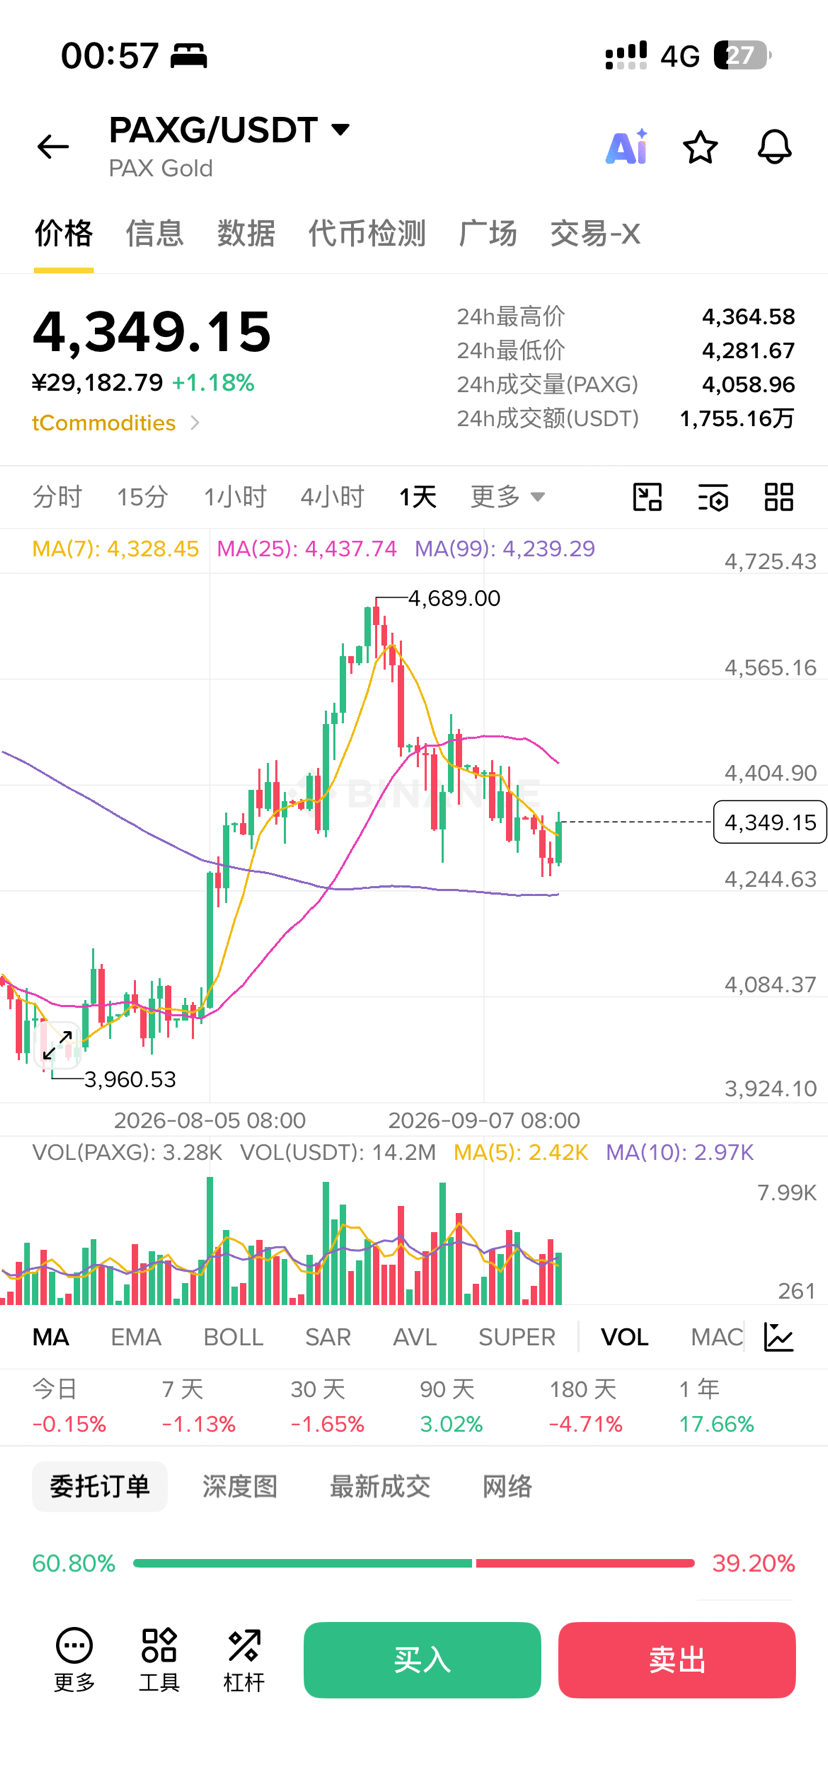
After the gold rebounds and hits the turning point, will it still drop and break below 4250?
Looking at gold on a naked K chart alone, it really does look like a head-and-shoulders top. But I don’t think we should only judge by pattern—volume can also be used as an auxiliary indicator.
In a typical head-and-shoulders top, the trading volume on the right shoulder is usually lower than on the left. But right now, gold has stronger volume on the right shoulder, higher than on the left. So I’m more inclined to believe there may be a stop-hunt move—i.e., the 4-hour-level rebound I mentioned in my previous post.
If this stop-hunt is ultimately confirmed, then for the bottom of this pullback, I temporarily expect it to be around 4200 (±50).
You shouldn’t jump to conclusions yet. The key is to watch the next 4-hour rebound, and then the second pullback after the rebound ends. Observe for a few more days, and it should become much clearer.
Looking at gold on a naked K chart alone, it really does look like a head-and-shoulders top. But I don’t think we should only judge by pattern—volume can also be used as an auxiliary indicator.
In a typical head-and-shoulders top, the trading volume on the right shoulder is usually lower than on the left. But right now, gold has stronger volume on the right shoulder, higher than on the left. So I’m more inclined to believe there may be a stop-hunt move—i.e., the 4-hour-level rebound I mentioned in my previous post.
If this stop-hunt is ultimately confirmed, then for the bottom of this pullback, I temporarily expect it to be around 4200 (±50).
You shouldn’t jump to conclusions yet. The key is to watch the next 4-hour rebound, and then the second pullback after the rebound ends. Observe for a few more days, and it should become much clearer.