$BTC Bitcoin Circle Academician: On Sept. 17, the major-level long framework for Bitcoin (BTC) has not been broken yet. Is this high-level shakeout building momentum or topping out? Latest market analysis and operation recommendations
Bitcoin’s current price is 76400. The long-versus-short battle has become extremely tense. Many people missed the earlier move, and now they’re afraid of chasing higher and getting trapped in losses. They want to buy the dip, but they worry there could be an even deeper pullback. After a rally with a big bullish candle, the market didn’t immediately continue the long trend. Instead, the price began moving sideways and shaking out. In the short term, capital keeps pulling back and forth—one single candlestick can change short-term sentiment. And for our short-term plan, we’ve laid out a position again below 76000 from the northbound direction. At this level, the bottom of the box range is where panic sentiment is spreading. Everything is being said to be bad—which is exactly the opportunity we’re positioning for.
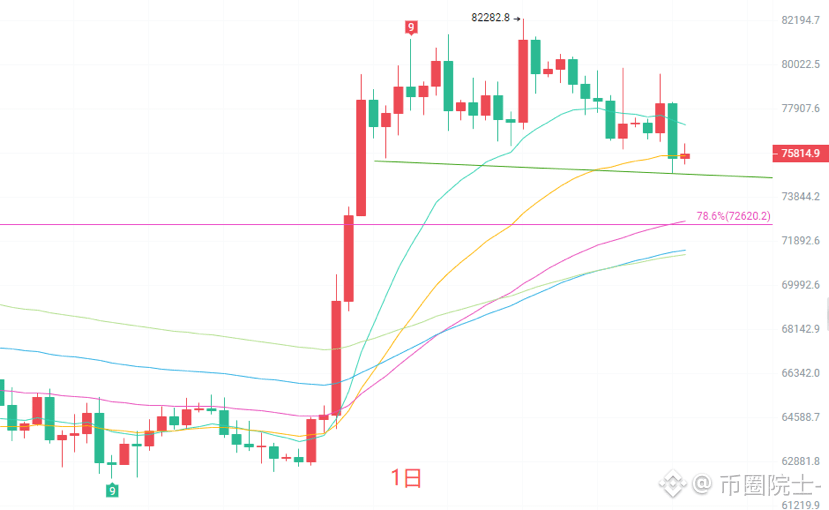
On the daily (K-line) chart, the overall structure still remains within this current uptrend. The short-term EMA moving-average cluster is still arranged upward. The mid-to-long-term long structure has not been broken. The MACD indicator’s red histogram continues shrinking, and the DIF line is starting to turn downward—bullish momentum is gradually weakening. The Bollinger Band middle rail forms strong support, while the upper-band pressure is around 78034. The daily level is a high-range consolidation after a rise—not a trend reversal. Strong resistance lies above at 80472, while key support is at 72620. As long as support holds and isn’t broken, the major-level long setup remains intact.
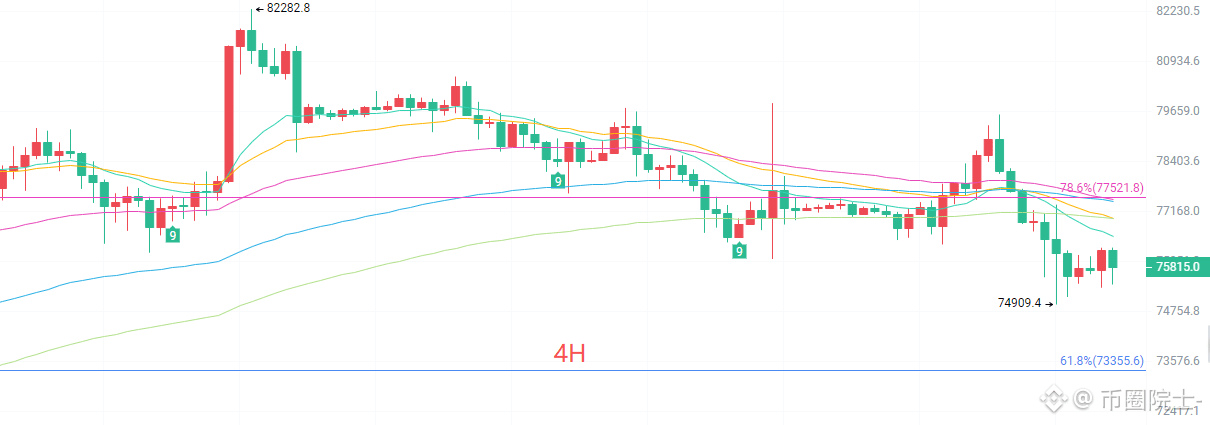
The four-hour (K-line) chart makes the short-term tug-of-war clearer. The short-term EMA moving averages have flattened and no longer diverge upward, and the upward momentum has slowed noticeably. The MACD’s two lines keep falling, and the green histogram shows a slight expansion—short-term bearish strength has increased. The Bollinger Bands are tightening, suggesting the market is about to choose a direction. Resistance is at 77521 above, and the first support is at 73355 below. We’ve entered a range-trading zone—neither long nor short has absolute advantage. For the short term, prioritize handling it with a range-trading mindset: either enter based on the current price together with me, or wait for a breakout and then follow the move.
Next short-term references
Buy northbound from 73600 to 73100, stop-loss at 500 points, target 77500 to 80400
Sell southbound from 77500 to 77800 (stall zone), stop-loss at 500 points, target 77000 to 76000
Specific execution should be based on real-time order-book data. For more information, check the author’s updates. Note: the article has a publication delay; this is for reference only—risk is your own.
#BTC走势分析
Bitcoin’s current price is 76400. The long-versus-short battle has become extremely tense. Many people missed the earlier move, and now they’re afraid of chasing higher and getting trapped in losses. They want to buy the dip, but they worry there could be an even deeper pullback. After a rally with a big bullish candle, the market didn’t immediately continue the long trend. Instead, the price began moving sideways and shaking out. In the short term, capital keeps pulling back and forth—one single candlestick can change short-term sentiment. And for our short-term plan, we’ve laid out a position again below 76000 from the northbound direction. At this level, the bottom of the box range is where panic sentiment is spreading. Everything is being said to be bad—which is exactly the opportunity we’re positioning for.
On the daily (K-line) chart, the overall structure still remains within this current uptrend. The short-term EMA moving-average cluster is still arranged upward. The mid-to-long-term long structure has not been broken. The MACD indicator’s red histogram continues shrinking, and the DIF line is starting to turn downward—bullish momentum is gradually weakening. The Bollinger Band middle rail forms strong support, while the upper-band pressure is around 78034. The daily level is a high-range consolidation after a rise—not a trend reversal. Strong resistance lies above at 80472, while key support is at 72620. As long as support holds and isn’t broken, the major-level long setup remains intact.
The four-hour (K-line) chart makes the short-term tug-of-war clearer. The short-term EMA moving averages have flattened and no longer diverge upward, and the upward momentum has slowed noticeably. The MACD’s two lines keep falling, and the green histogram shows a slight expansion—short-term bearish strength has increased. The Bollinger Bands are tightening, suggesting the market is about to choose a direction. Resistance is at 77521 above, and the first support is at 73355 below. We’ve entered a range-trading zone—neither long nor short has absolute advantage. For the short term, prioritize handling it with a range-trading mindset: either enter based on the current price together with me, or wait for a breakout and then follow the move.
Next short-term references
Buy northbound from 73600 to 73100, stop-loss at 500 points, target 77500 to 80400
Sell southbound from 77500 to 77800 (stall zone), stop-loss at 500 points, target 77000 to 76000
Specific execution should be based on real-time order-book data. For more information, check the author’s updates. Note: the article has a publication delay; this is for reference only—risk is your own.
#BTC走势分析