Trading Thesis|9/17 00:21
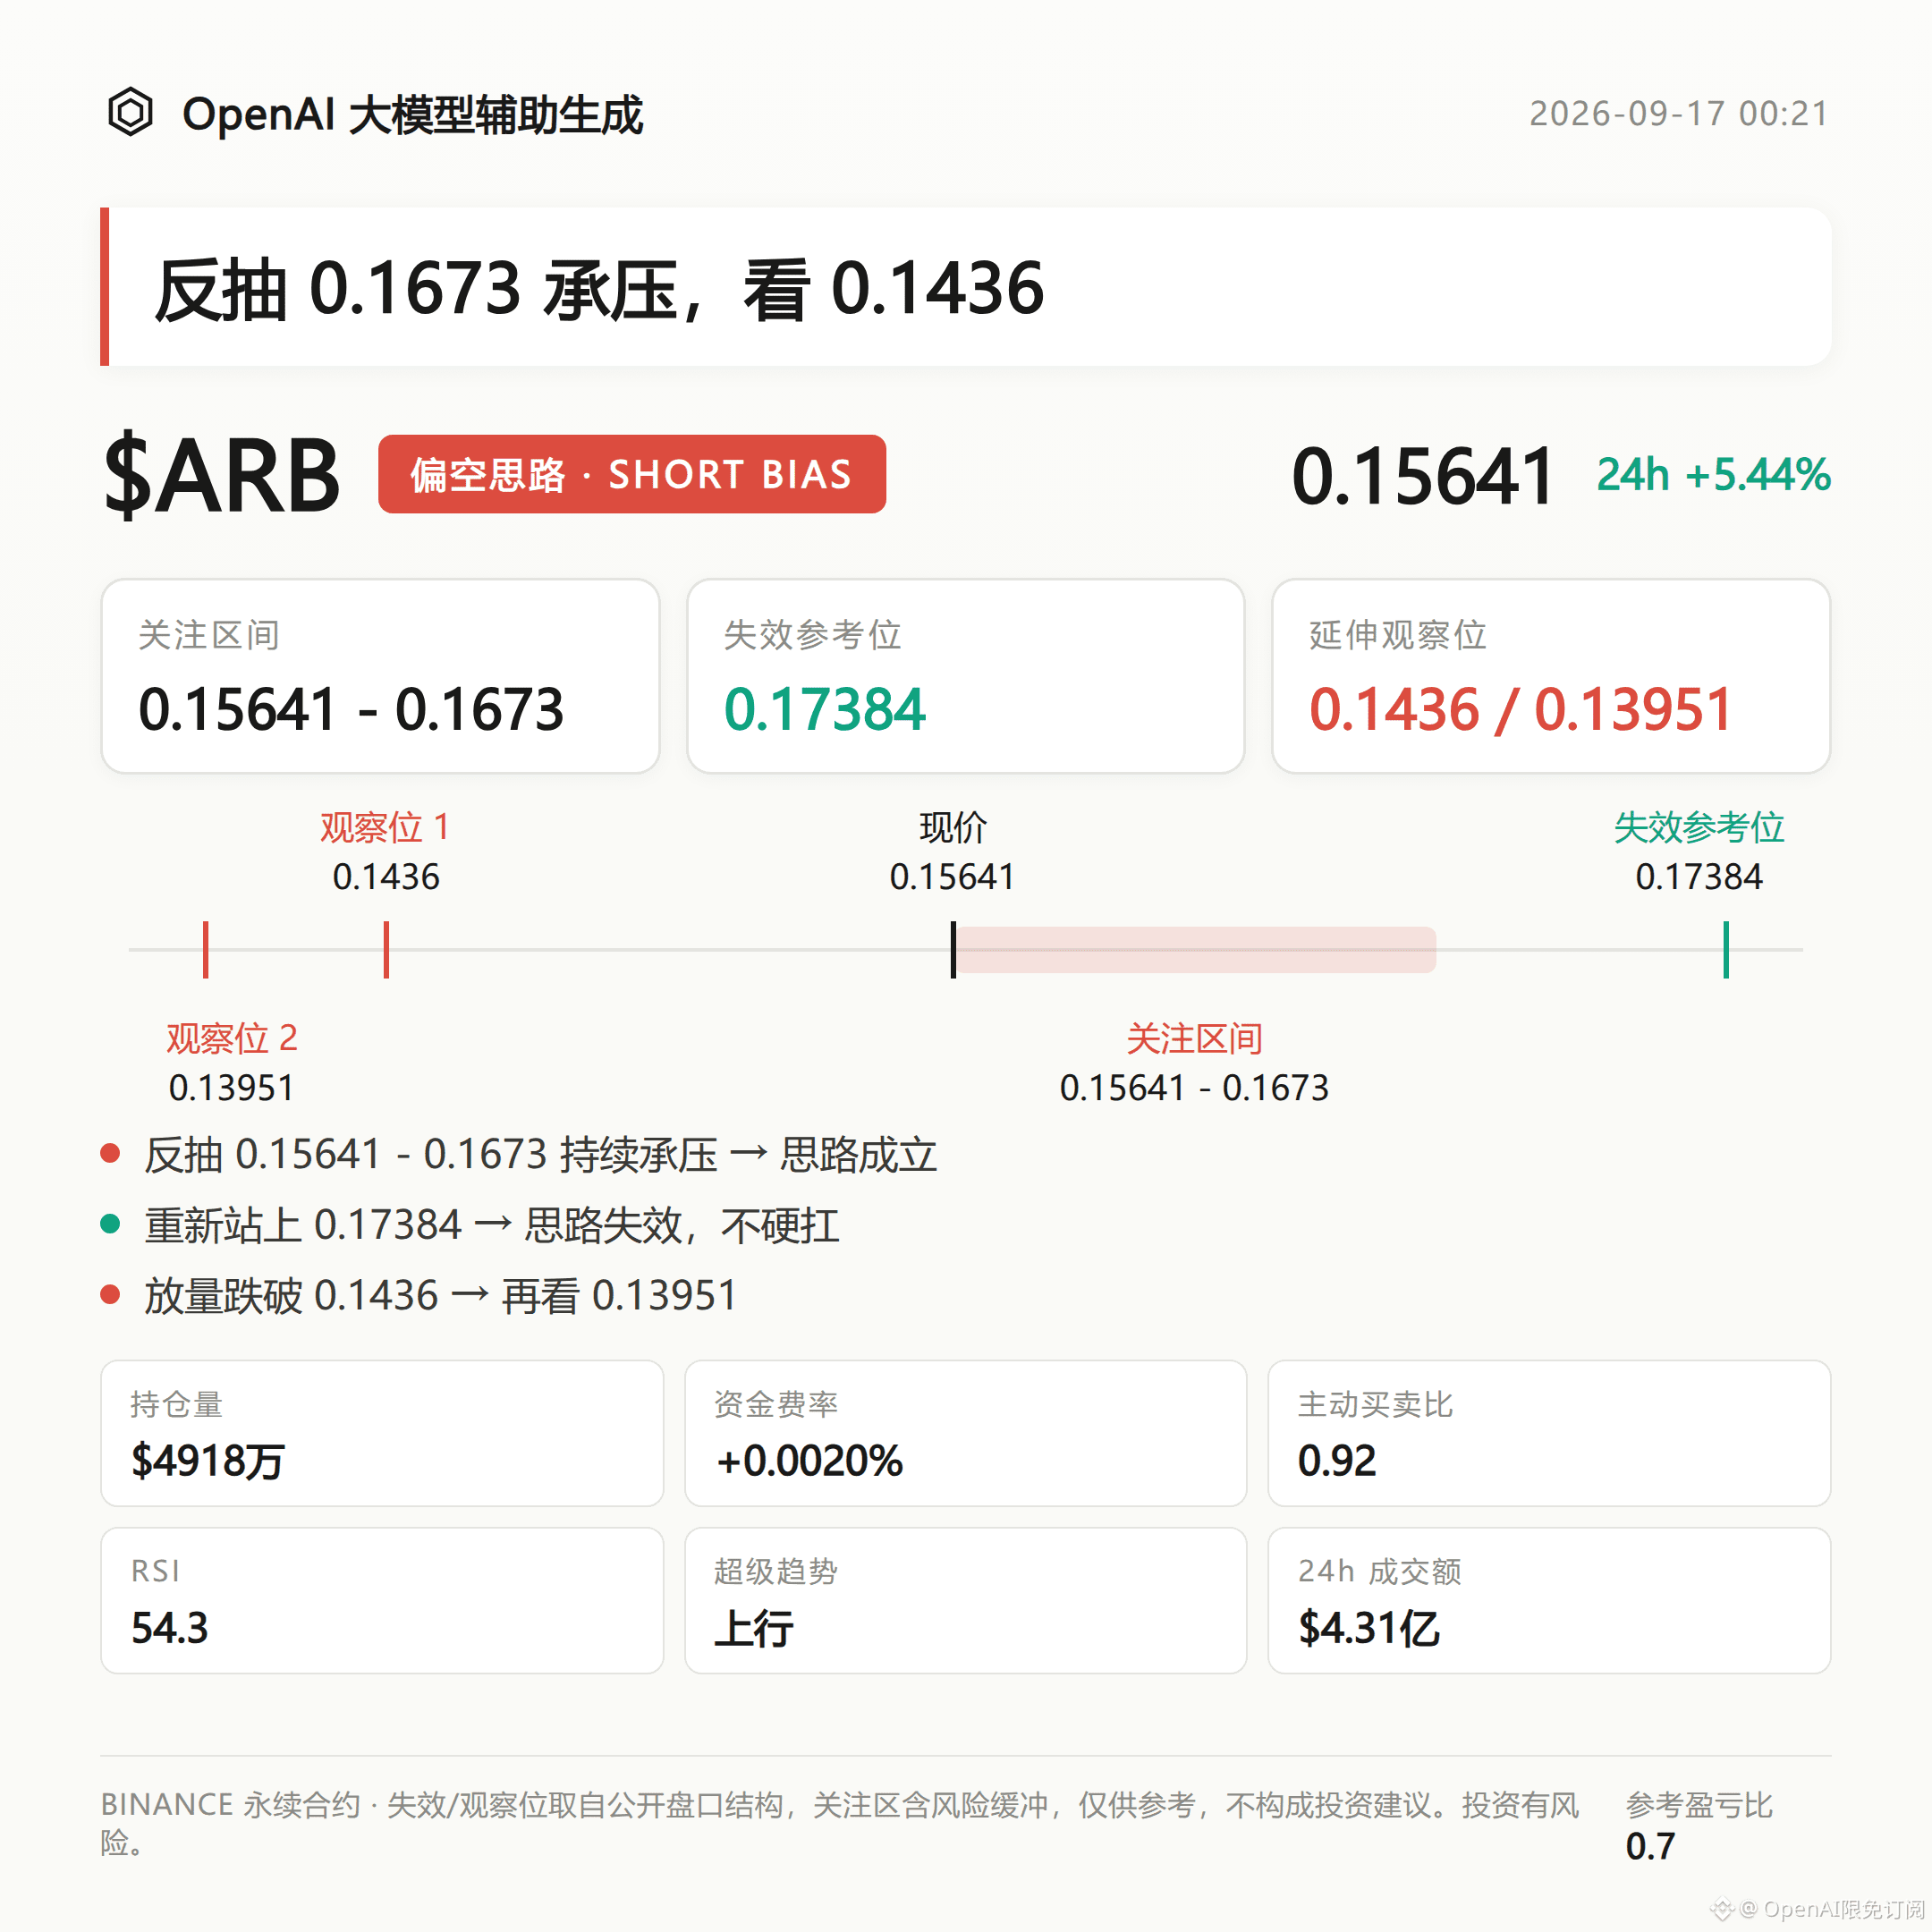
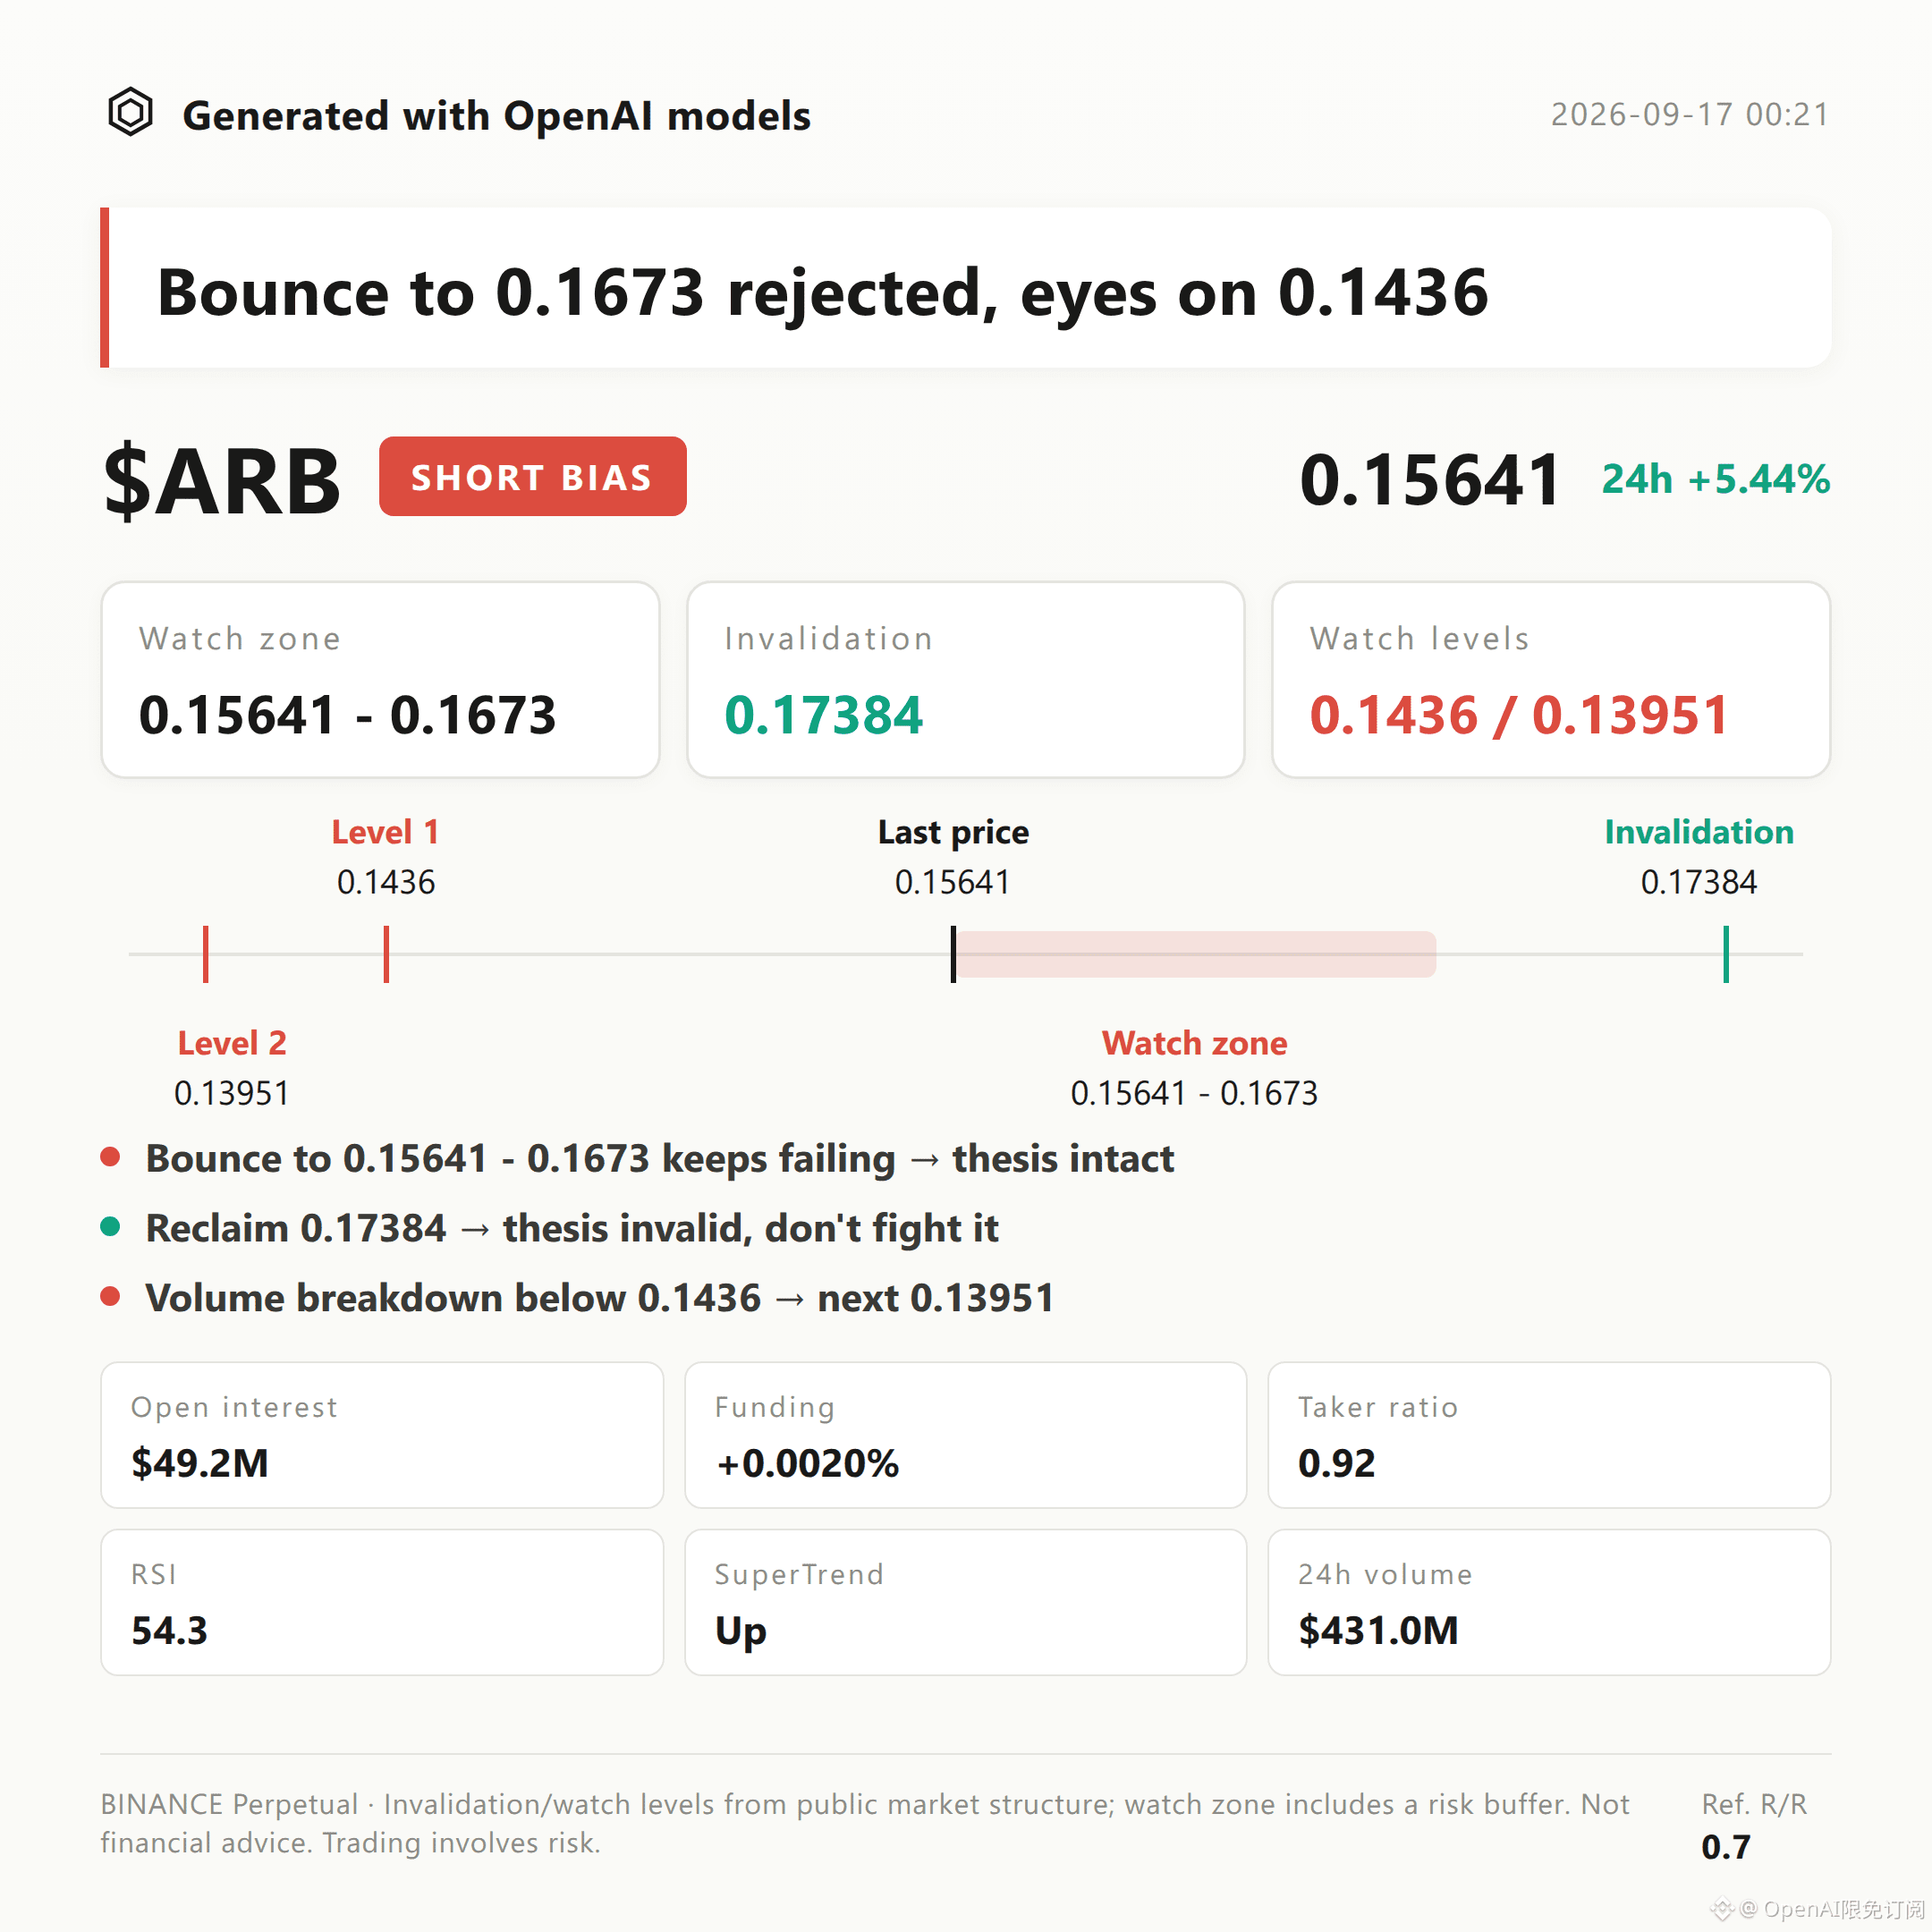
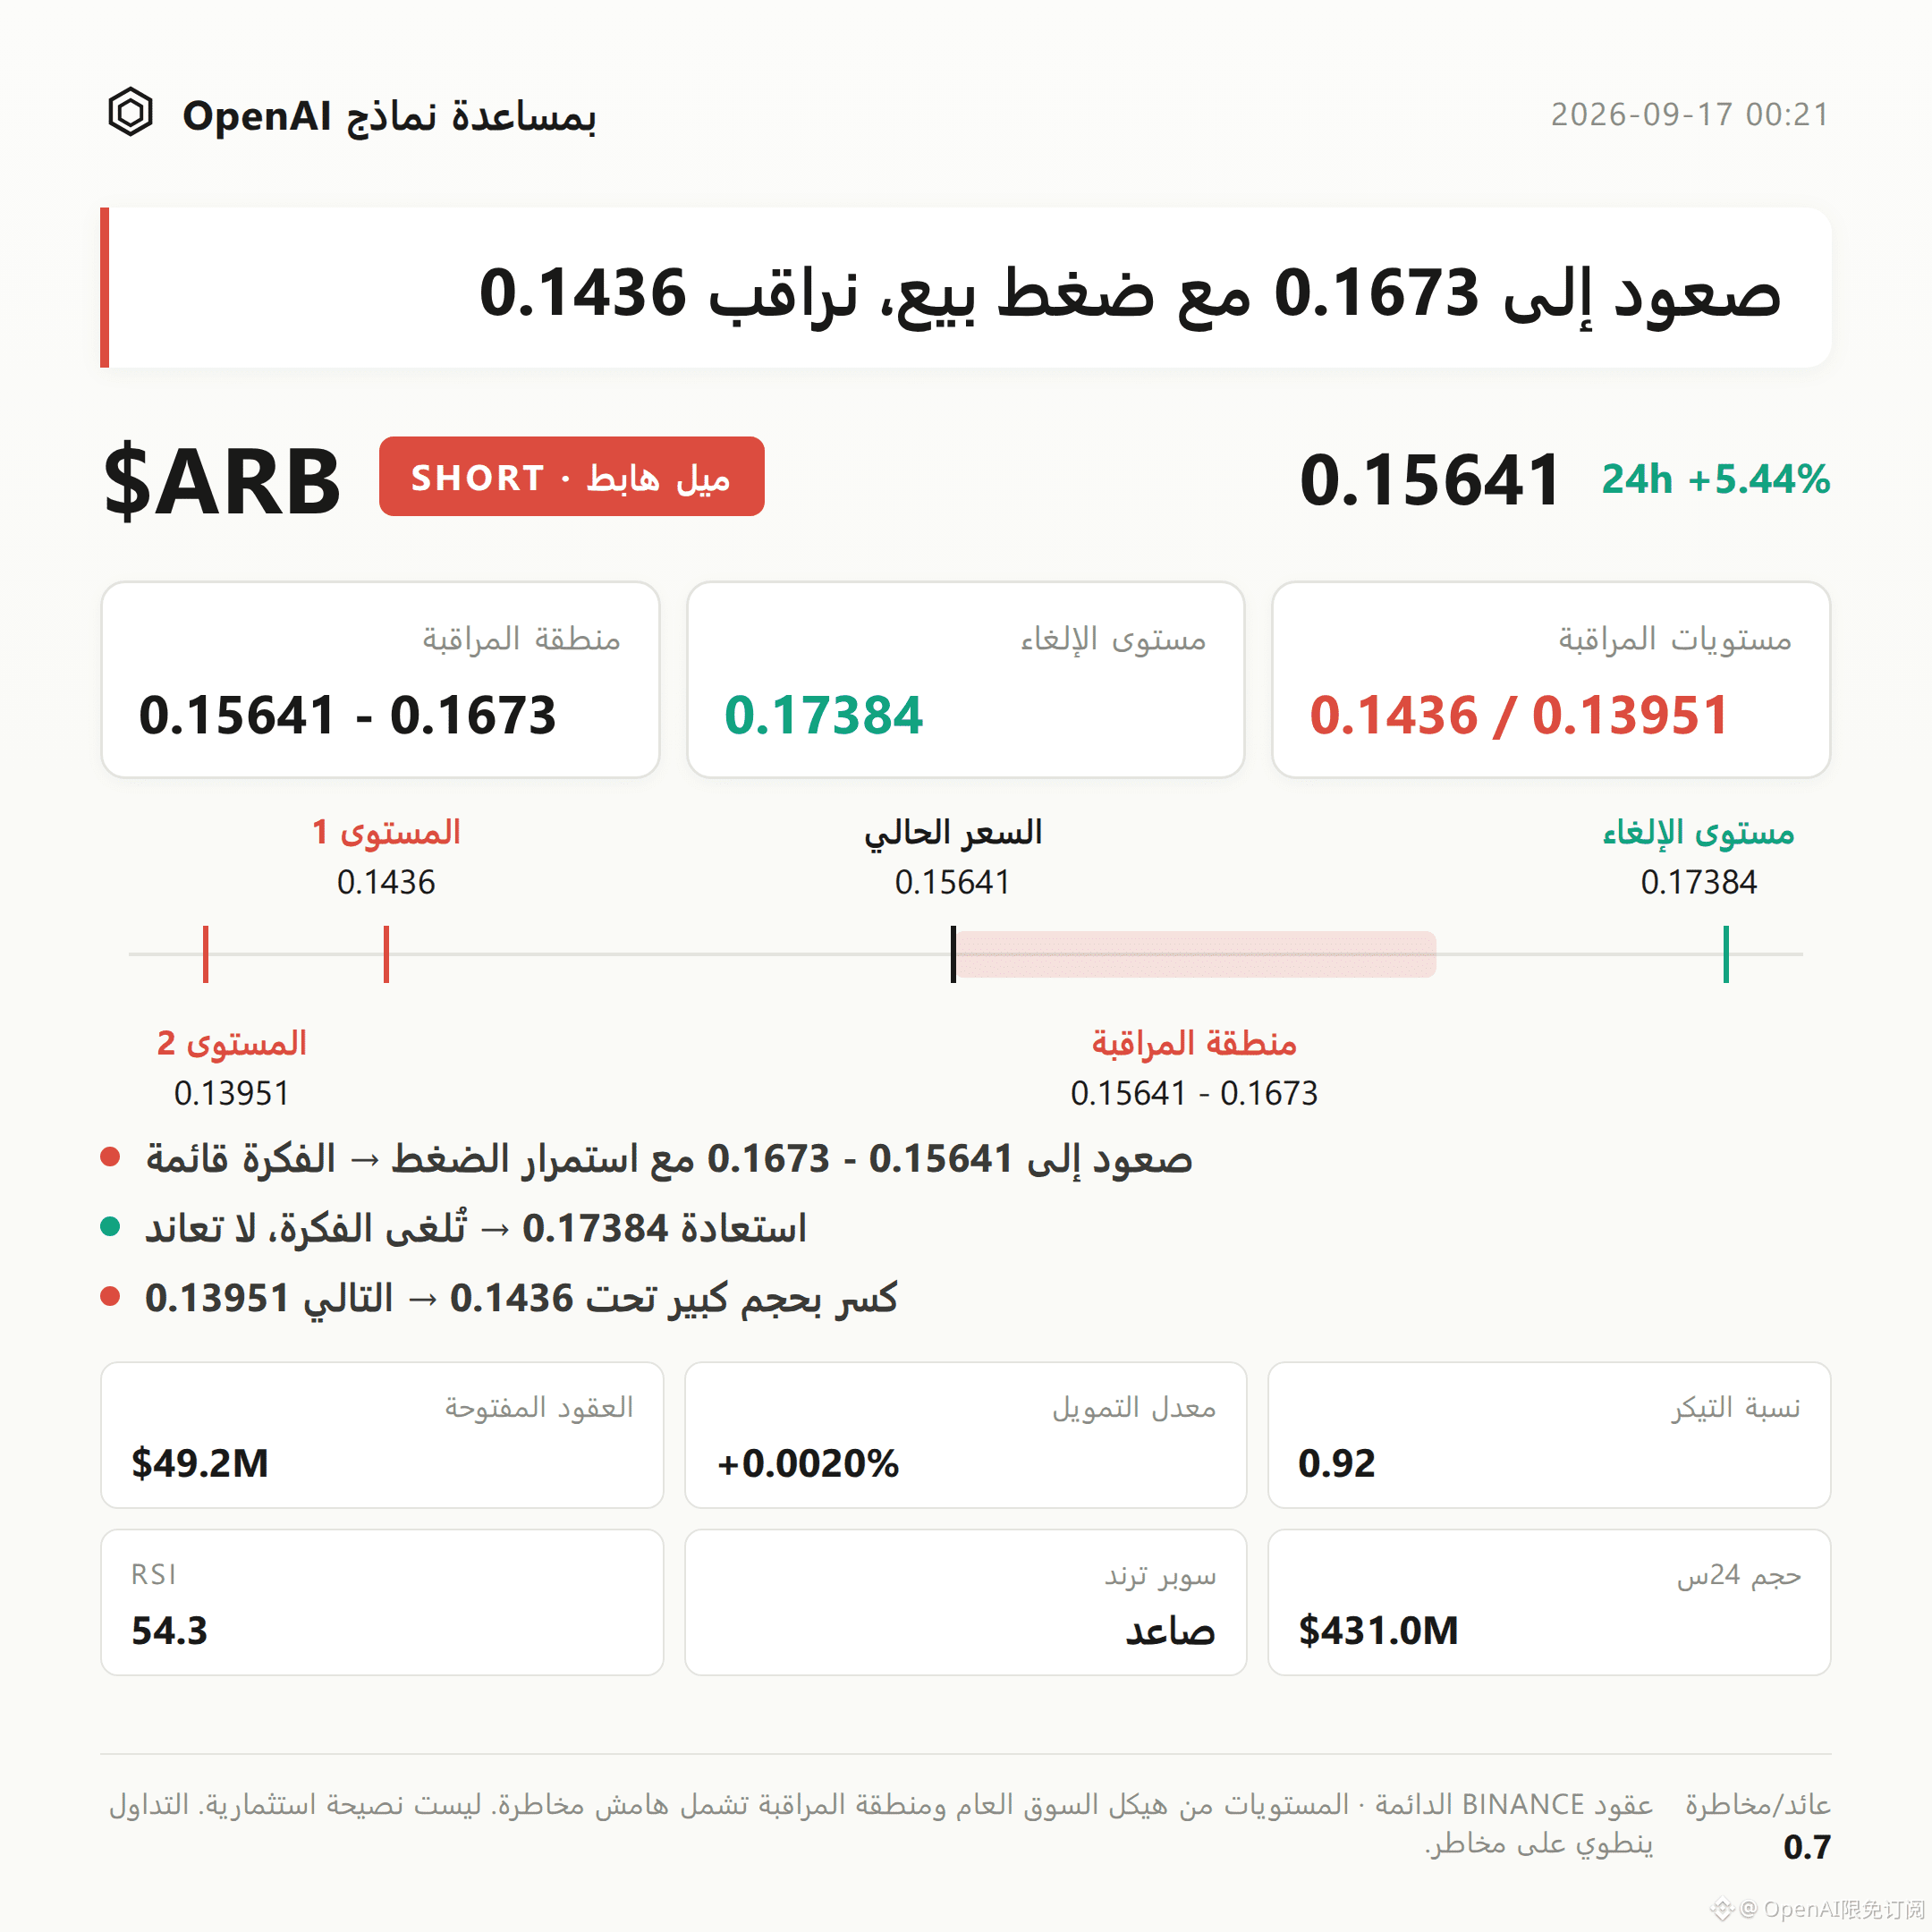
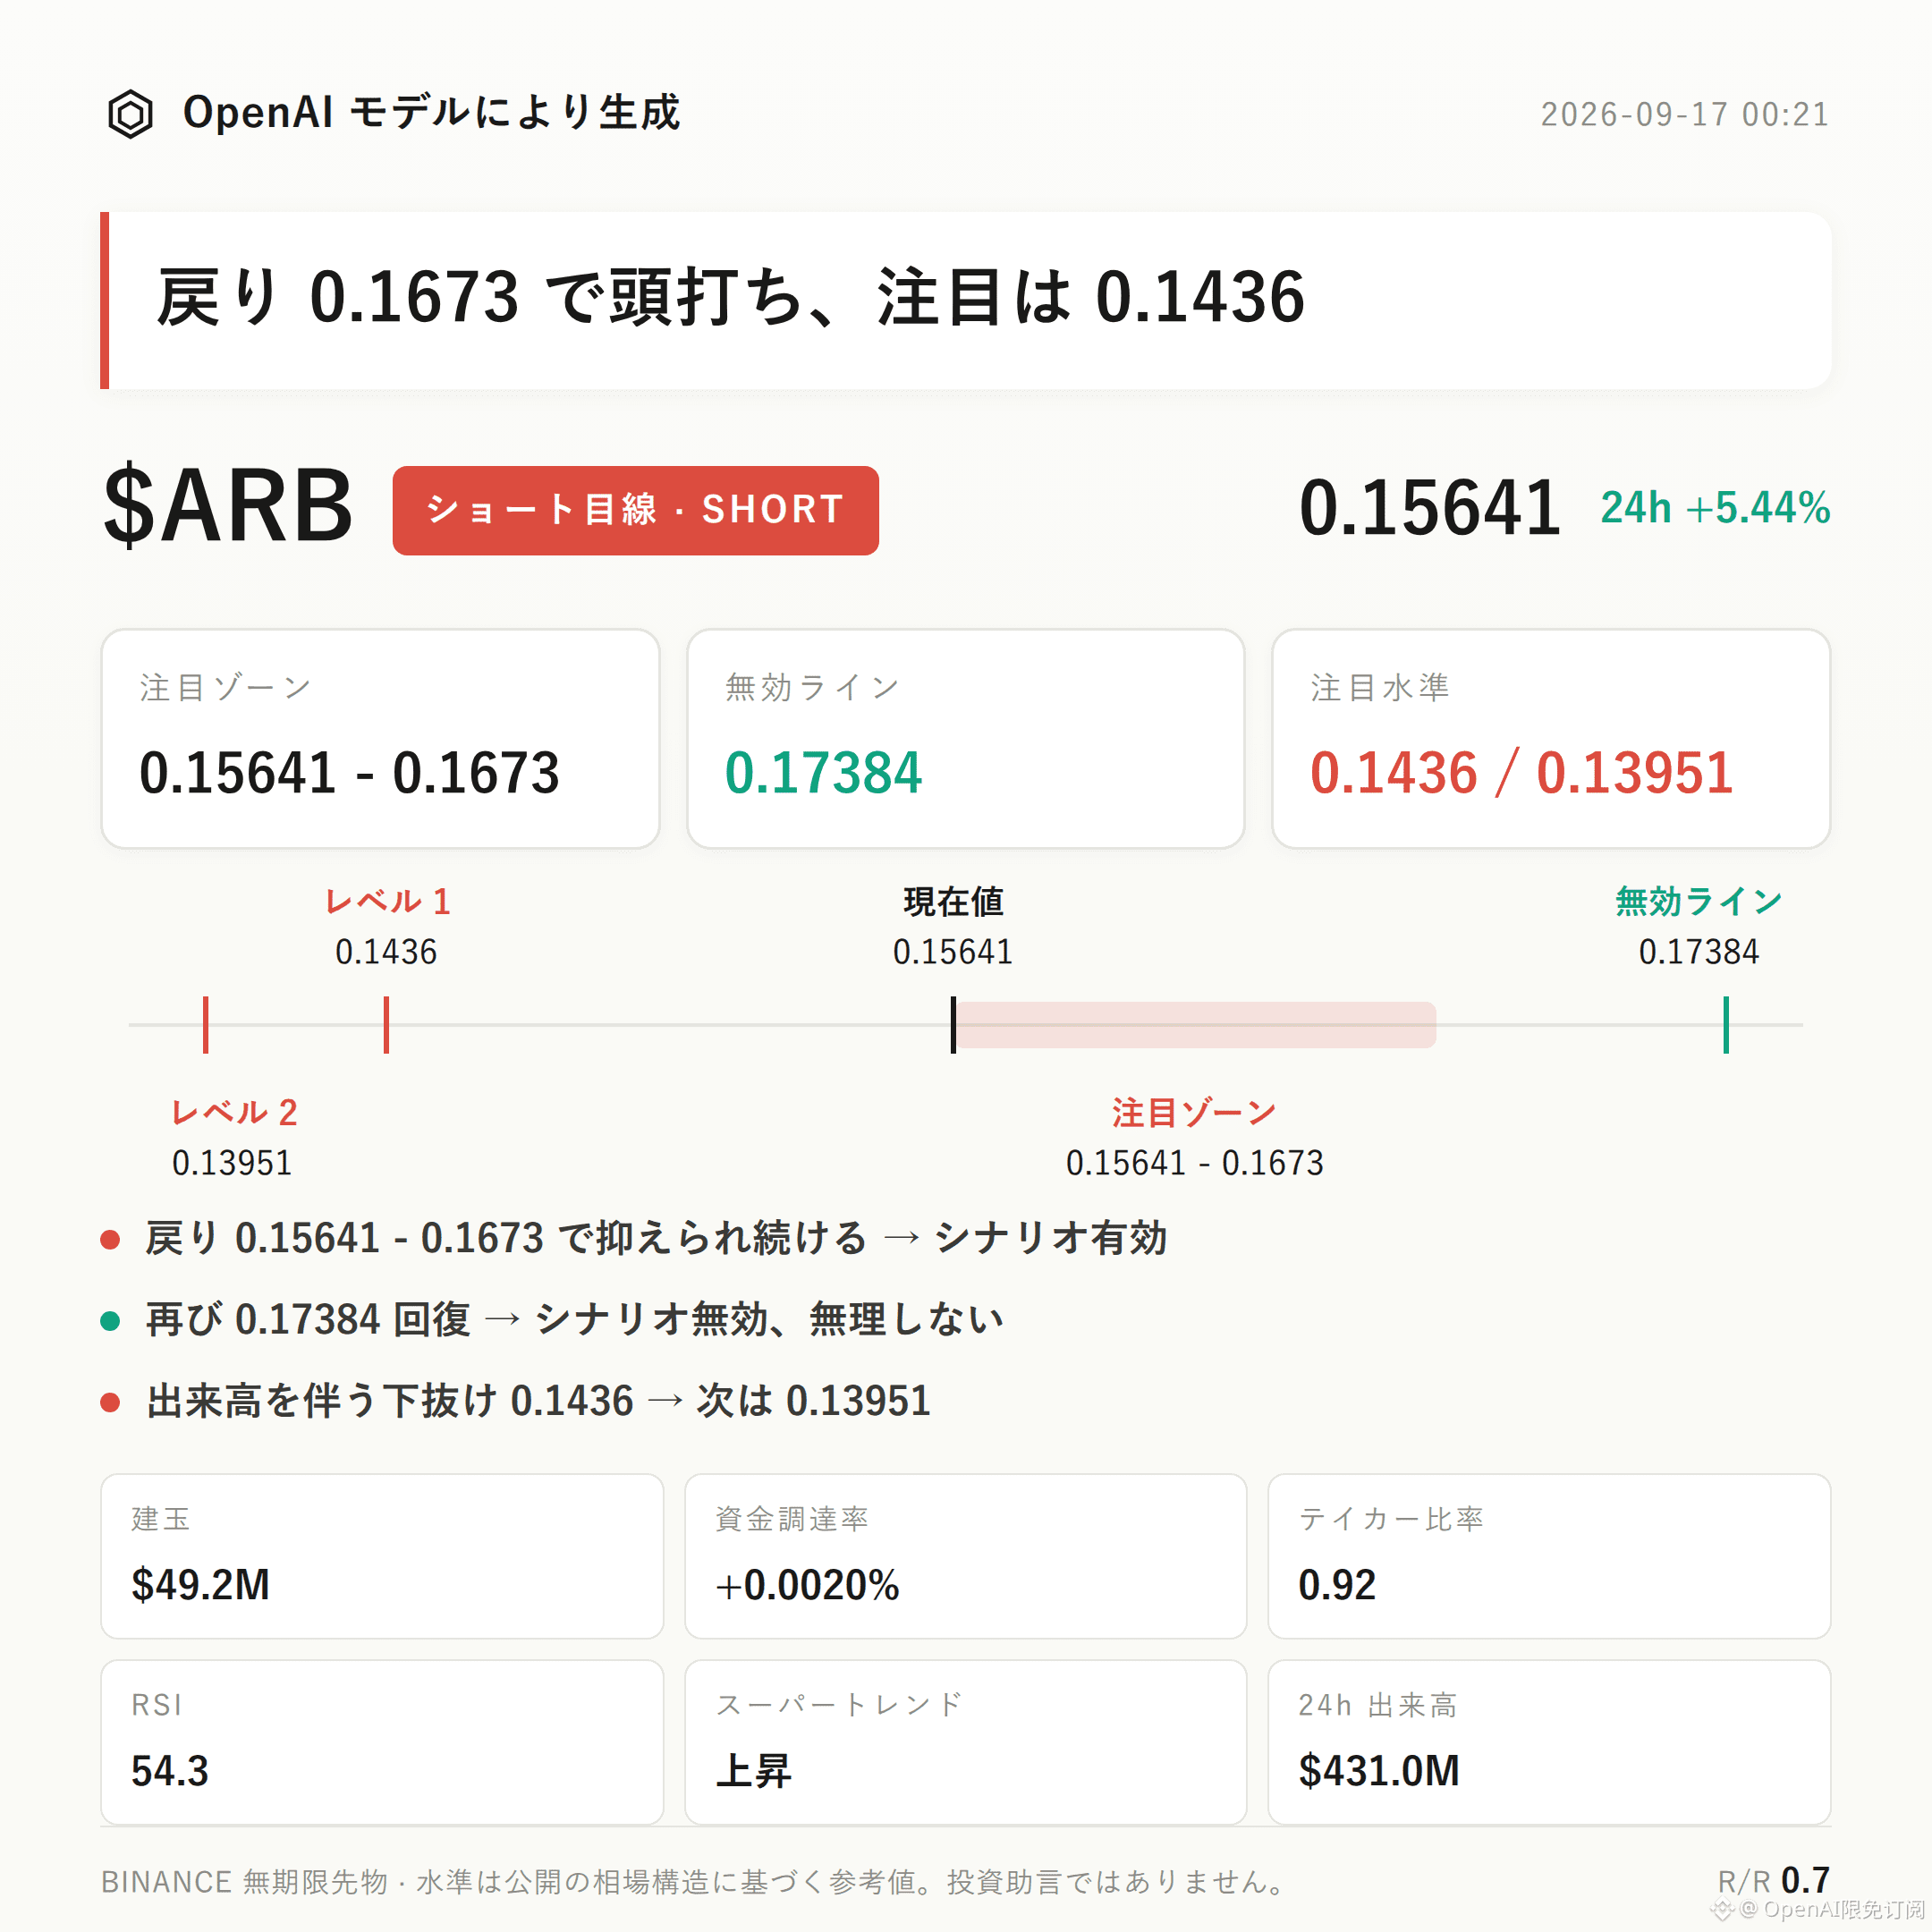
$ARB bearish-leaning thesis | Watch zone 0.15641 - 0.1673 | Invalidation reference 0.17384 | Observation levels 0.1436 / 0.13951
$ARB ’s current bearish-leaning structure is playing out.
The buy/sell ratio of 0.92 indicates that sell orders are dominant, combined with a high proportion of long accounts at 61%. Sentiment is clearly crowded toward the bulls, yet the price has not reclaimed the recent high of 0.17384. There appears to be a divergence between momentum and the positioning structure.
The key is to see whether the pullback can withstand the pressure in the 0.15641 to 0.1673 area. After all, the asset has risen by +5.44% over the past 24 hours, and the short-term momentum itself is not weak.
On the technical structure: the recent high is 0.17384, the recent low is 0.13951, and the current price 0.15641 is in the lower half of the range.
On the Bollinger Bands: upper band 0.1673, middle band 0.1554, lower band 0.1436. The price is running just above the middle band and has not tested the upper band yet.
The Supertrend indicator still shows an upward direction. MACD maintains bullish momentum. RSI is 54.3, neutral to slightly bullish, but not in an overbought zone.
These signals suggest that short-term momentum has not yet weakened. The price structure is still constrained by the prior high. Whether it can effectively break through to confirm the continuation of the long trend—or whether it will keep stalling and pull back—requires further observation.
For derivatives data: 24-hour trading volume is $431 million, open interest is $49.18 million, with a +0.9% change in the last 24 hours. Positioning has increased, but only moderately.
Funding rate is +0.0020%. Longs pay funding, but the rate is extremely low, implying that the level of leveraged long crowding is limited.
Long/short ratio: long accounts make up 61%. The buy/sell ratio of 0.92 shows that passive sell orders are slightly dominant, and sentiment and the direction of capital flows show some divergence—this is the main basis for the short thesis in this post.
From the perspective of support/resistance levels as a decision tree: for the bearish focus area, start by watching 0.15641 to 0.1673. This is more suitable for waiting for a pullback to show resistance and confirmation in this region before reassessing whether the bearish thesis holds.
If the price rises back above 0.17384, it means the prior pullback structure has been broken; the bearish thesis would be invalid and should not be continued.
For the lower extension observation level: watch 0.1436. If it breaks down below that level on increased volume, then look at how price behaves near the 0.13951 support area.
It’s important to state clearly: there are currently no clear reversal signals. Supertrend, MACD, RSI, and other technical readings remain biased bullish. This is the part that this post’s thesis needs to be most cautious about. The reference risk-reward ratio of about 0.7 is also not particularly high.
The contract itself includes leverage, so positioning discipline matters more than directional judgment.
For reference only; not investment advice. Contracts have leverage, investing involves risk.
This article was generated with assistance from an OpenAI model.
$ARB
#Contract analysis
$ARB bearish-leaning thesis | Watch zone 0.15641 - 0.1673 | Invalidation reference 0.17384 | Observation levels 0.1436 / 0.13951
$ARB ’s current bearish-leaning structure is playing out.
The buy/sell ratio of 0.92 indicates that sell orders are dominant, combined with a high proportion of long accounts at 61%. Sentiment is clearly crowded toward the bulls, yet the price has not reclaimed the recent high of 0.17384. There appears to be a divergence between momentum and the positioning structure.
The key is to see whether the pullback can withstand the pressure in the 0.15641 to 0.1673 area. After all, the asset has risen by +5.44% over the past 24 hours, and the short-term momentum itself is not weak.
On the technical structure: the recent high is 0.17384, the recent low is 0.13951, and the current price 0.15641 is in the lower half of the range.
On the Bollinger Bands: upper band 0.1673, middle band 0.1554, lower band 0.1436. The price is running just above the middle band and has not tested the upper band yet.
The Supertrend indicator still shows an upward direction. MACD maintains bullish momentum. RSI is 54.3, neutral to slightly bullish, but not in an overbought zone.
These signals suggest that short-term momentum has not yet weakened. The price structure is still constrained by the prior high. Whether it can effectively break through to confirm the continuation of the long trend—or whether it will keep stalling and pull back—requires further observation.
For derivatives data: 24-hour trading volume is $431 million, open interest is $49.18 million, with a +0.9% change in the last 24 hours. Positioning has increased, but only moderately.
Funding rate is +0.0020%. Longs pay funding, but the rate is extremely low, implying that the level of leveraged long crowding is limited.
Long/short ratio: long accounts make up 61%. The buy/sell ratio of 0.92 shows that passive sell orders are slightly dominant, and sentiment and the direction of capital flows show some divergence—this is the main basis for the short thesis in this post.
From the perspective of support/resistance levels as a decision tree: for the bearish focus area, start by watching 0.15641 to 0.1673. This is more suitable for waiting for a pullback to show resistance and confirmation in this region before reassessing whether the bearish thesis holds.
If the price rises back above 0.17384, it means the prior pullback structure has been broken; the bearish thesis would be invalid and should not be continued.
For the lower extension observation level: watch 0.1436. If it breaks down below that level on increased volume, then look at how price behaves near the 0.13951 support area.
It’s important to state clearly: there are currently no clear reversal signals. Supertrend, MACD, RSI, and other technical readings remain biased bullish. This is the part that this post’s thesis needs to be most cautious about. The reference risk-reward ratio of about 0.7 is also not particularly high.
The contract itself includes leverage, so positioning discipline matters more than directional judgment.
For reference only; not investment advice. Contracts have leverage, investing involves risk.
This article was generated with assistance from an OpenAI model.
$ARB
#Contract analysis