
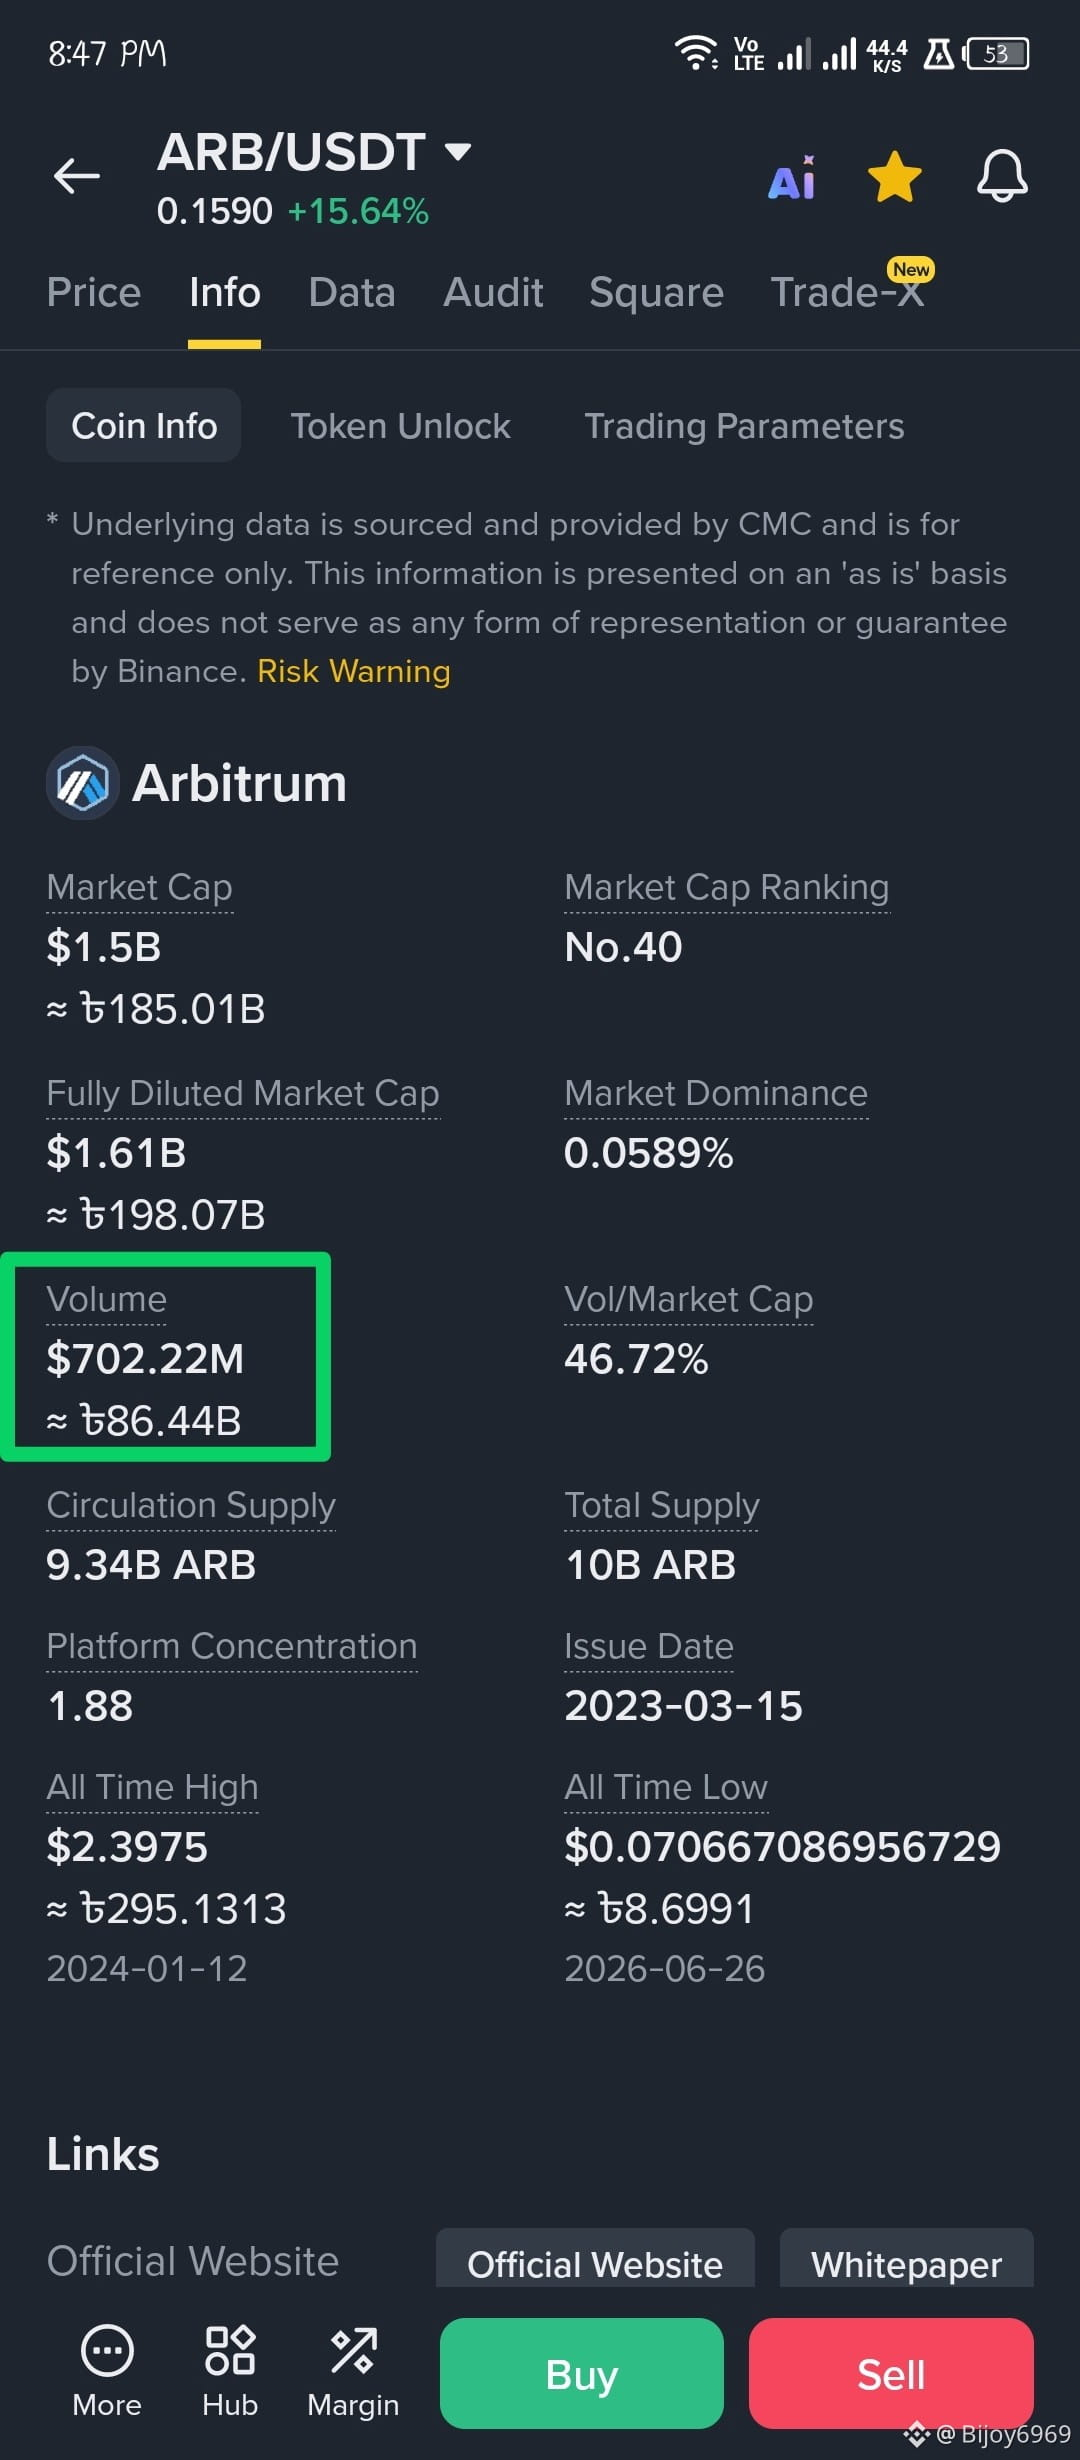
$ARB I hold for 1.5$


Post

Crypto_shojib
·
--
ARB/USDT — 1W Chart Analysis
Your weekly ARB chart shows a major long-term downtrend, but the recent rebound is strong. ARB is around $0.165, with today’s market data also showing a sharp weekly/24h move. �
Key levels from your chart:
🟢 Support: $0.13–$0.14
🟢 Major support: $0.10–$0.11
🔴 Immediate resistance: $0.18–$0.20
🔴 Next resistance: $0.23–$0.25
🔴 Major long-term resistance: ~$0.45–$0.50
📊 Structure
The most important feature is the descending trendline from the 2024–2025 highs. ARB is now approaching that trendline around the $0.18–$0.20 region.
Bullish confirmation: A strong weekly close above the descending trendline, followed by holding it as support, would indicate a meaningful change in the long-term structure.
Your weekly ARB chart shows a major long-term downtrend, but the recent rebound is strong. ARB is around $0.165, with today’s market data also showing a sharp weekly/24h move. �
Key levels from your chart:
🟢 Support: $0.13–$0.14
🟢 Major support: $0.10–$0.11
🔴 Immediate resistance: $0.18–$0.20
🔴 Next resistance: $0.23–$0.25
🔴 Major long-term resistance: ~$0.45–$0.50
📊 Structure
The most important feature is the descending trendline from the 2024–2025 highs. ARB is now approaching that trendline around the $0.18–$0.20 region.
Bullish confirmation: A strong weekly close above the descending trendline, followed by holding it as support, would indicate a meaningful change in the long-term structure.
Disclaimer: Includes third-party opinions. No advice. Binance AI may be used without guarantee. See T&Cs.