Moving Average Convergence, RSI Approaching Oversold—Is the Pullback for $CRCLB an Opportunity or a Trap?
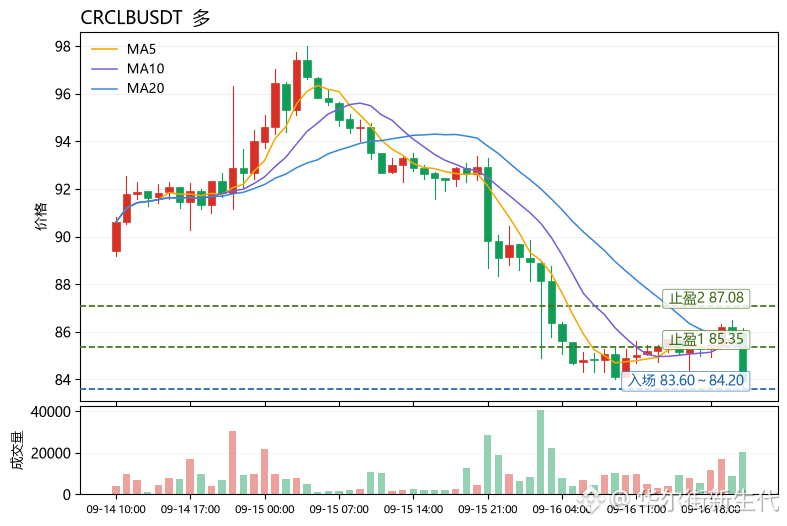
The answer leans toward an opportunity within the “trap” scenario: the current price is 83.93, down 7.19% in 24h, but MA5=85.352 is still slightly higher than MA20=85.3495. The moving averages are sticking together rather than showing bearish divergence, indicating this is a technical pullback after a sharp drop—not a trend reversal. RSI=30.6 is already close to the oversold zone. MACD histogram remains positive at +0.2404, supporting the bullish side. The price at 83.93 is also pressing near the lower band around 83.6139, with the lower band acting as the first buffer. The Fear & Greed Index is 51—neutral—so sentiment is not extreme and downside momentum is limited.
For execution: consider entering via CRCLB at 83.60~84.20, i.e., the confluence area between the lower Bollinger Band and the current price. Take-profit 1: 85.35, corresponding to the MA5/MA20 convergence resistance. Take-profit 2: 87.08, near the upper Bollinger Band. Set stop-loss at 82.80. If price breaks below the lower band and the MACD histogram turns negative, the structure is likely to fail. The risk is that MA5 and MA20 are only separated by 0.0025; direction can change at any time. Wait for the histogram expansion to confirm.
Also watch in parallel: $SOL, $ARB. SOL current price is 96.94 with RSI=38.9, showing weak consolidation. ARB surged 20.90%; after that, RSI=79.4 has already entered the overbought zone, with a clear short-term divergence in strength.
(Personal opinion only for reference and does not constitute investment advice. Contract risk is extremely high—please strictly control your position size.)
【Data】
Coin: CRCLBUSDT
Direction: Long
Entry: 83.60~84.20
Take-profit 1: 85.35
Take-profit 2: 87.08
Stop-loss: 82.80
The answer leans toward an opportunity within the “trap” scenario: the current price is 83.93, down 7.19% in 24h, but MA5=85.352 is still slightly higher than MA20=85.3495. The moving averages are sticking together rather than showing bearish divergence, indicating this is a technical pullback after a sharp drop—not a trend reversal. RSI=30.6 is already close to the oversold zone. MACD histogram remains positive at +0.2404, supporting the bullish side. The price at 83.93 is also pressing near the lower band around 83.6139, with the lower band acting as the first buffer. The Fear & Greed Index is 51—neutral—so sentiment is not extreme and downside momentum is limited.
For execution: consider entering via CRCLB at 83.60~84.20, i.e., the confluence area between the lower Bollinger Band and the current price. Take-profit 1: 85.35, corresponding to the MA5/MA20 convergence resistance. Take-profit 2: 87.08, near the upper Bollinger Band. Set stop-loss at 82.80. If price breaks below the lower band and the MACD histogram turns negative, the structure is likely to fail. The risk is that MA5 and MA20 are only separated by 0.0025; direction can change at any time. Wait for the histogram expansion to confirm.
Also watch in parallel: $SOL, $ARB. SOL current price is 96.94 with RSI=38.9, showing weak consolidation. ARB surged 20.90%; after that, RSI=79.4 has already entered the overbought zone, with a clear short-term divergence in strength.
(Personal opinion only for reference and does not constitute investment advice. Contract risk is extremely high—please strictly control your position size.)
【Data】
Coin: CRCLBUSDT
Direction: Long
Entry: 83.60~84.20
Take-profit 1: 85.35
Take-profit 2: 87.08
Stop-loss: 82.80