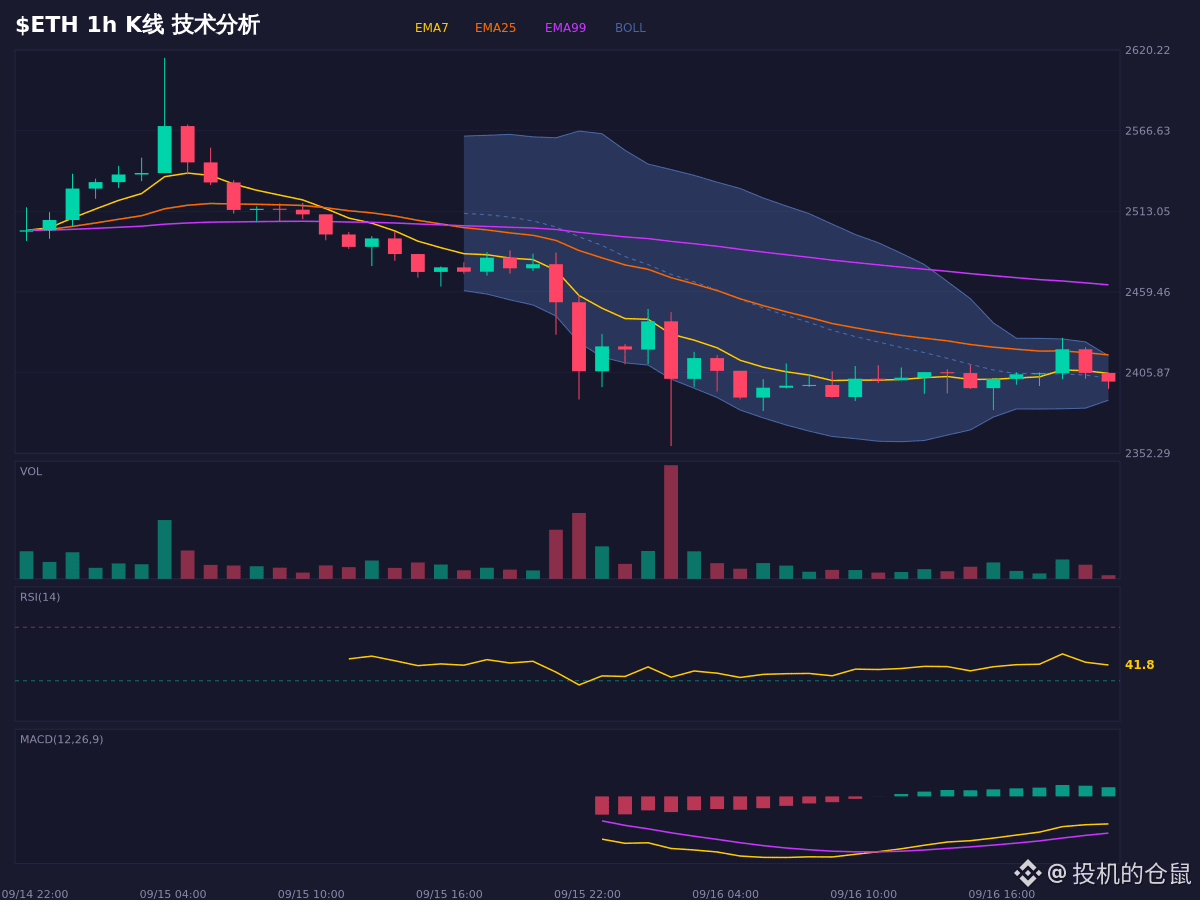
$ETH Current price 2397 USDT. On the 1H timeframe, a clear bullish divergence has formed: although price has made a new low, the RSI refuses to fall. This usually indicates that selling pressure is weakening.
Although the MACD shows bullish momentum, the shortening histogram bars suggest that the momentum is fading. In the short term, the price may consolidate or range. Interestingly, the long-to-short ratio shows the long position share rising to 56.3%, which directly contradicts the moving-average system that’s arranged against the shorts.
If price can stabilize in the 2406–2417 range, the bullish structure may continue. If it breaks below the 2381 support level, the logic behind the current rebound will be invalid. OBV indicates that funds are continuously flowing in, providing support for the rebound from a capital-flow perspective.
For market observation and scenario analysis only; this does not constitute a record of trading actions.
$ETH #市场情绪 #合约 #bull market
Although the MACD shows bullish momentum, the shortening histogram bars suggest that the momentum is fading. In the short term, the price may consolidate or range. Interestingly, the long-to-short ratio shows the long position share rising to 56.3%, which directly contradicts the moving-average system that’s arranged against the shorts.
If price can stabilize in the 2406–2417 range, the bullish structure may continue. If it breaks below the 2381 support level, the logic behind the current rebound will be invalid. OBV indicates that funds are continuously flowing in, providing support for the rebound from a capital-flow perspective.
For market observation and scenario analysis only; this does not constitute a record of trading actions.
$ETH #市场情绪 #合约 #bull market