



Watching the market tides rise and fall—nothing more than the bull-bear cycle
On the way of trading: greed, anger, delusion, obsession—like floating in the sea of desire

▍This FOMC rate decision will be released at 2:00 a.m. on September 17, with a press conference at 2:30:
The market is currently pricing in a 25bp rate hike with a very high level of certainty—almost a foregone conclusion. I think that if it’s just one hike and they don’t plan to keep hiking afterward, it could actually be positive.
If it’s +25bp and the dot plot continues to be revised higher, with further hikes even in December or continuing into 2027, then that would be quite something. The key is that Warsh old fool is always so vague with his wording—it’s really hard to deal with!$BTC

The key point is what Waller says. One rate hike has already been fully priced in. But if he goes hawkish and says things like, “If inflation rises, the Fed will take necessary measures,” the market might fall even further. I think he’s likely to do this.
▍ If you look at the ETF data: today there are net inflows, tomorrow net outflows, the day after tomorrow net inflows again, and the big day after tomorrow net outflows again. What does that mean? Does it feel like you’re getting confused?
But actually, there’s no need to make it that complicated. To know whether more is being sold or more is being bought, just look at the balance, right? Changes in the balance trend reflect the overall participants’ mindset and behavior more directly.
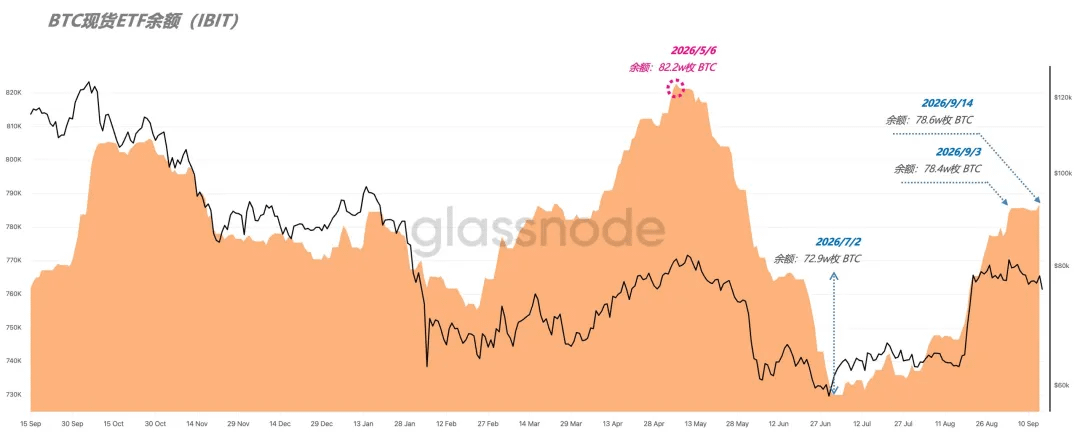
The total balance of the current US spot BTC ETFs is 1,265k BTC. Of that, BlackRock’s IBIT and Fidelity’s FBTC together account for 76%, so we’ll focus only on these two—no need to look at the others.
Also, in the usual sense, BlackRock’s institutional share is higher, and Fidelity itself is also one of the biggest retail brokerage firms in the US. Comparing the data from the two companies side by side is even more interesting:
IBIT’s balance peak occurred in May of this year, not at the top of the bull market. It looks like BlackRock’s customers started buying the dip as early as February; by May, the holdings had already reached 822k BTC, a new all-time high.
The low in July was 72.9w BTC. After that, it started rising again all the way. By September 3, it had increased by 55k BTC. The key is that in the stretch from 9/3 to 9/4, the BTC price fell, but the balance didn’t decrease—so it’s not sensitive to short-term price fluctuations.
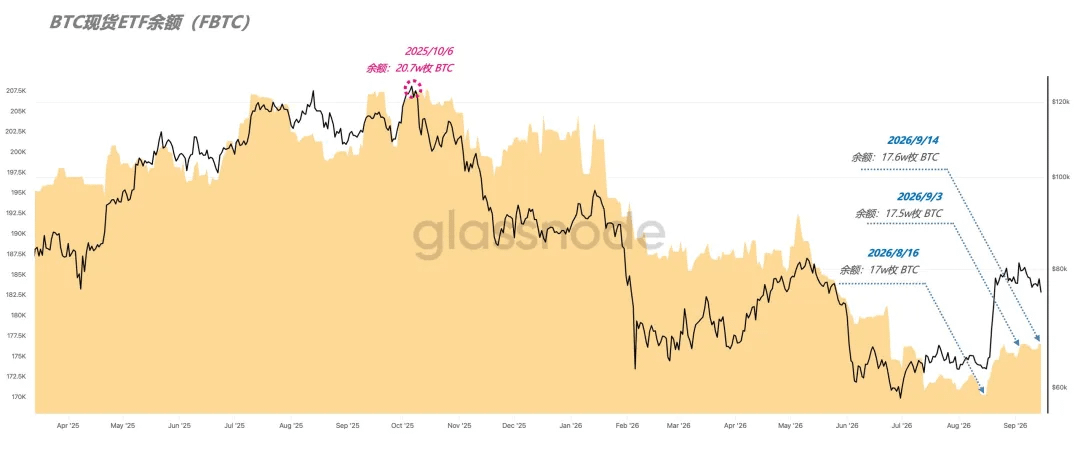
But FBTC is completely different from IBIT. Its balance peak appears right at the top of the bull market. After that, the price kept falling and the balance continued to decline. From February to May this year it mostly stayed roughly flat—there’s absolutely no sign of additional accumulation.
On August 16, FBTC’s balance fell to its lowest point, only 170k BTC. That means before this leg of the rally, FBTC’s customers were still constantly selling. This is typical “retail behavior,” which matches the pessimistic sentiment on Twitter at the time about 40k/30k perfectly.
After that, as the price rose, FBTC’s balance increased by about 5–6k coins. Not a lot, but looking at the period from 9/3 to 9/4, it also didn’t show any obvious decrease.
So, overall, at least for now, US investors’ sentiment is still fairly stable, and hasn’t swung back to panic due to macro uncertainty.
But clearly, the two main sources of buying power have not yet kicked into full “rampage mode.” The balance is still some distance away from the previous high. So, at most for now it can only be considered a bear-to-bull transition period. A full bull run is still early.
▍ Record: What won’t change is the outcome; the difference is the process.
1. Using Ethereum as the anchor: 2800 is an important middle level in the prior season of Ethereum. Above 2800, you go to 4000; below 2800, it’s weak. In the first wave of turning from bear to bull, it doesn’t feel like 2800 will be easy to get through.
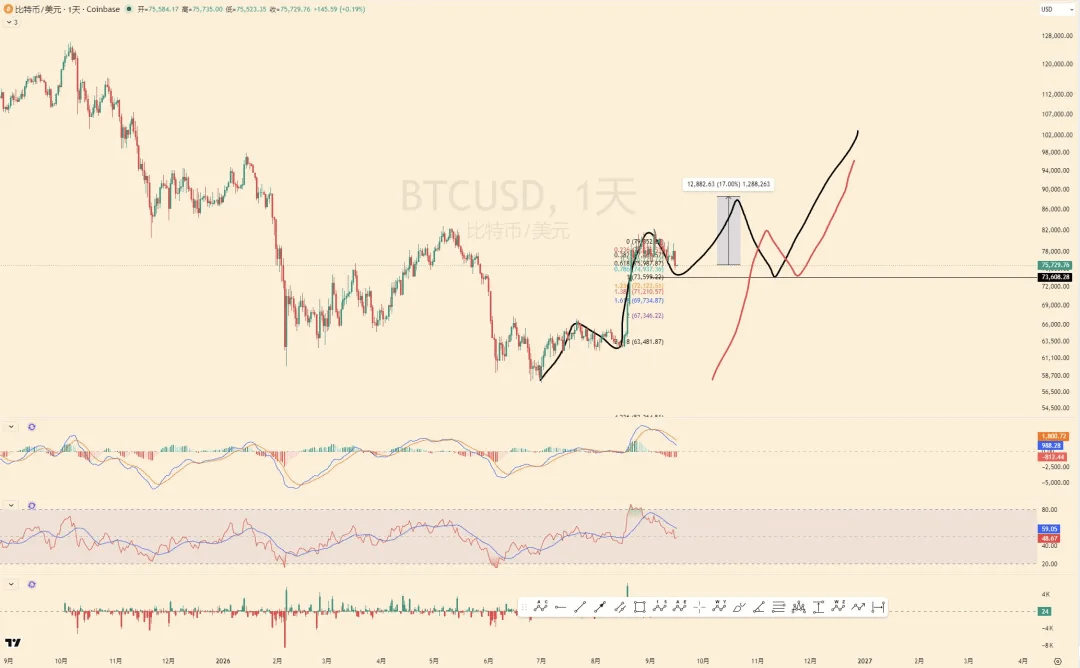
Based on what we saw for Ethereum, that’s how the black line in Figure 1 is used to project—so in reality could it be that it just reaches 2900 or even 3000? And the “big BTC” corresponds to 88,000–90,000. $
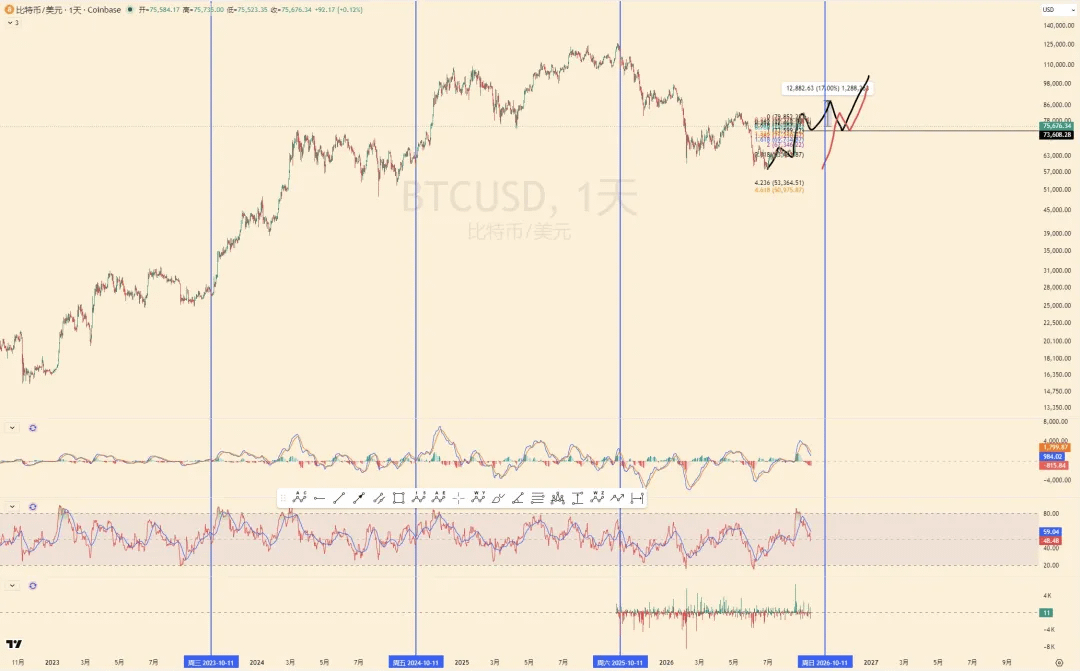
2. The more puzzling part is that when it’s carved into the wheel, $BTC in October indeed has a choppy range—according to the examples shown for 2023, 2024, and 2025, they were all launch months. By right, 2026 shouldn’t be a downward launch.
Turn back and forth between bear and bull without changing your original intention; don’t be greedy or impatient—keep moving forward steadily!
Independent thinking, respect logic, and embrace uncertainty!