🔥 $BTC Long Term Holders Are Flashing A Rare Cycle Signal
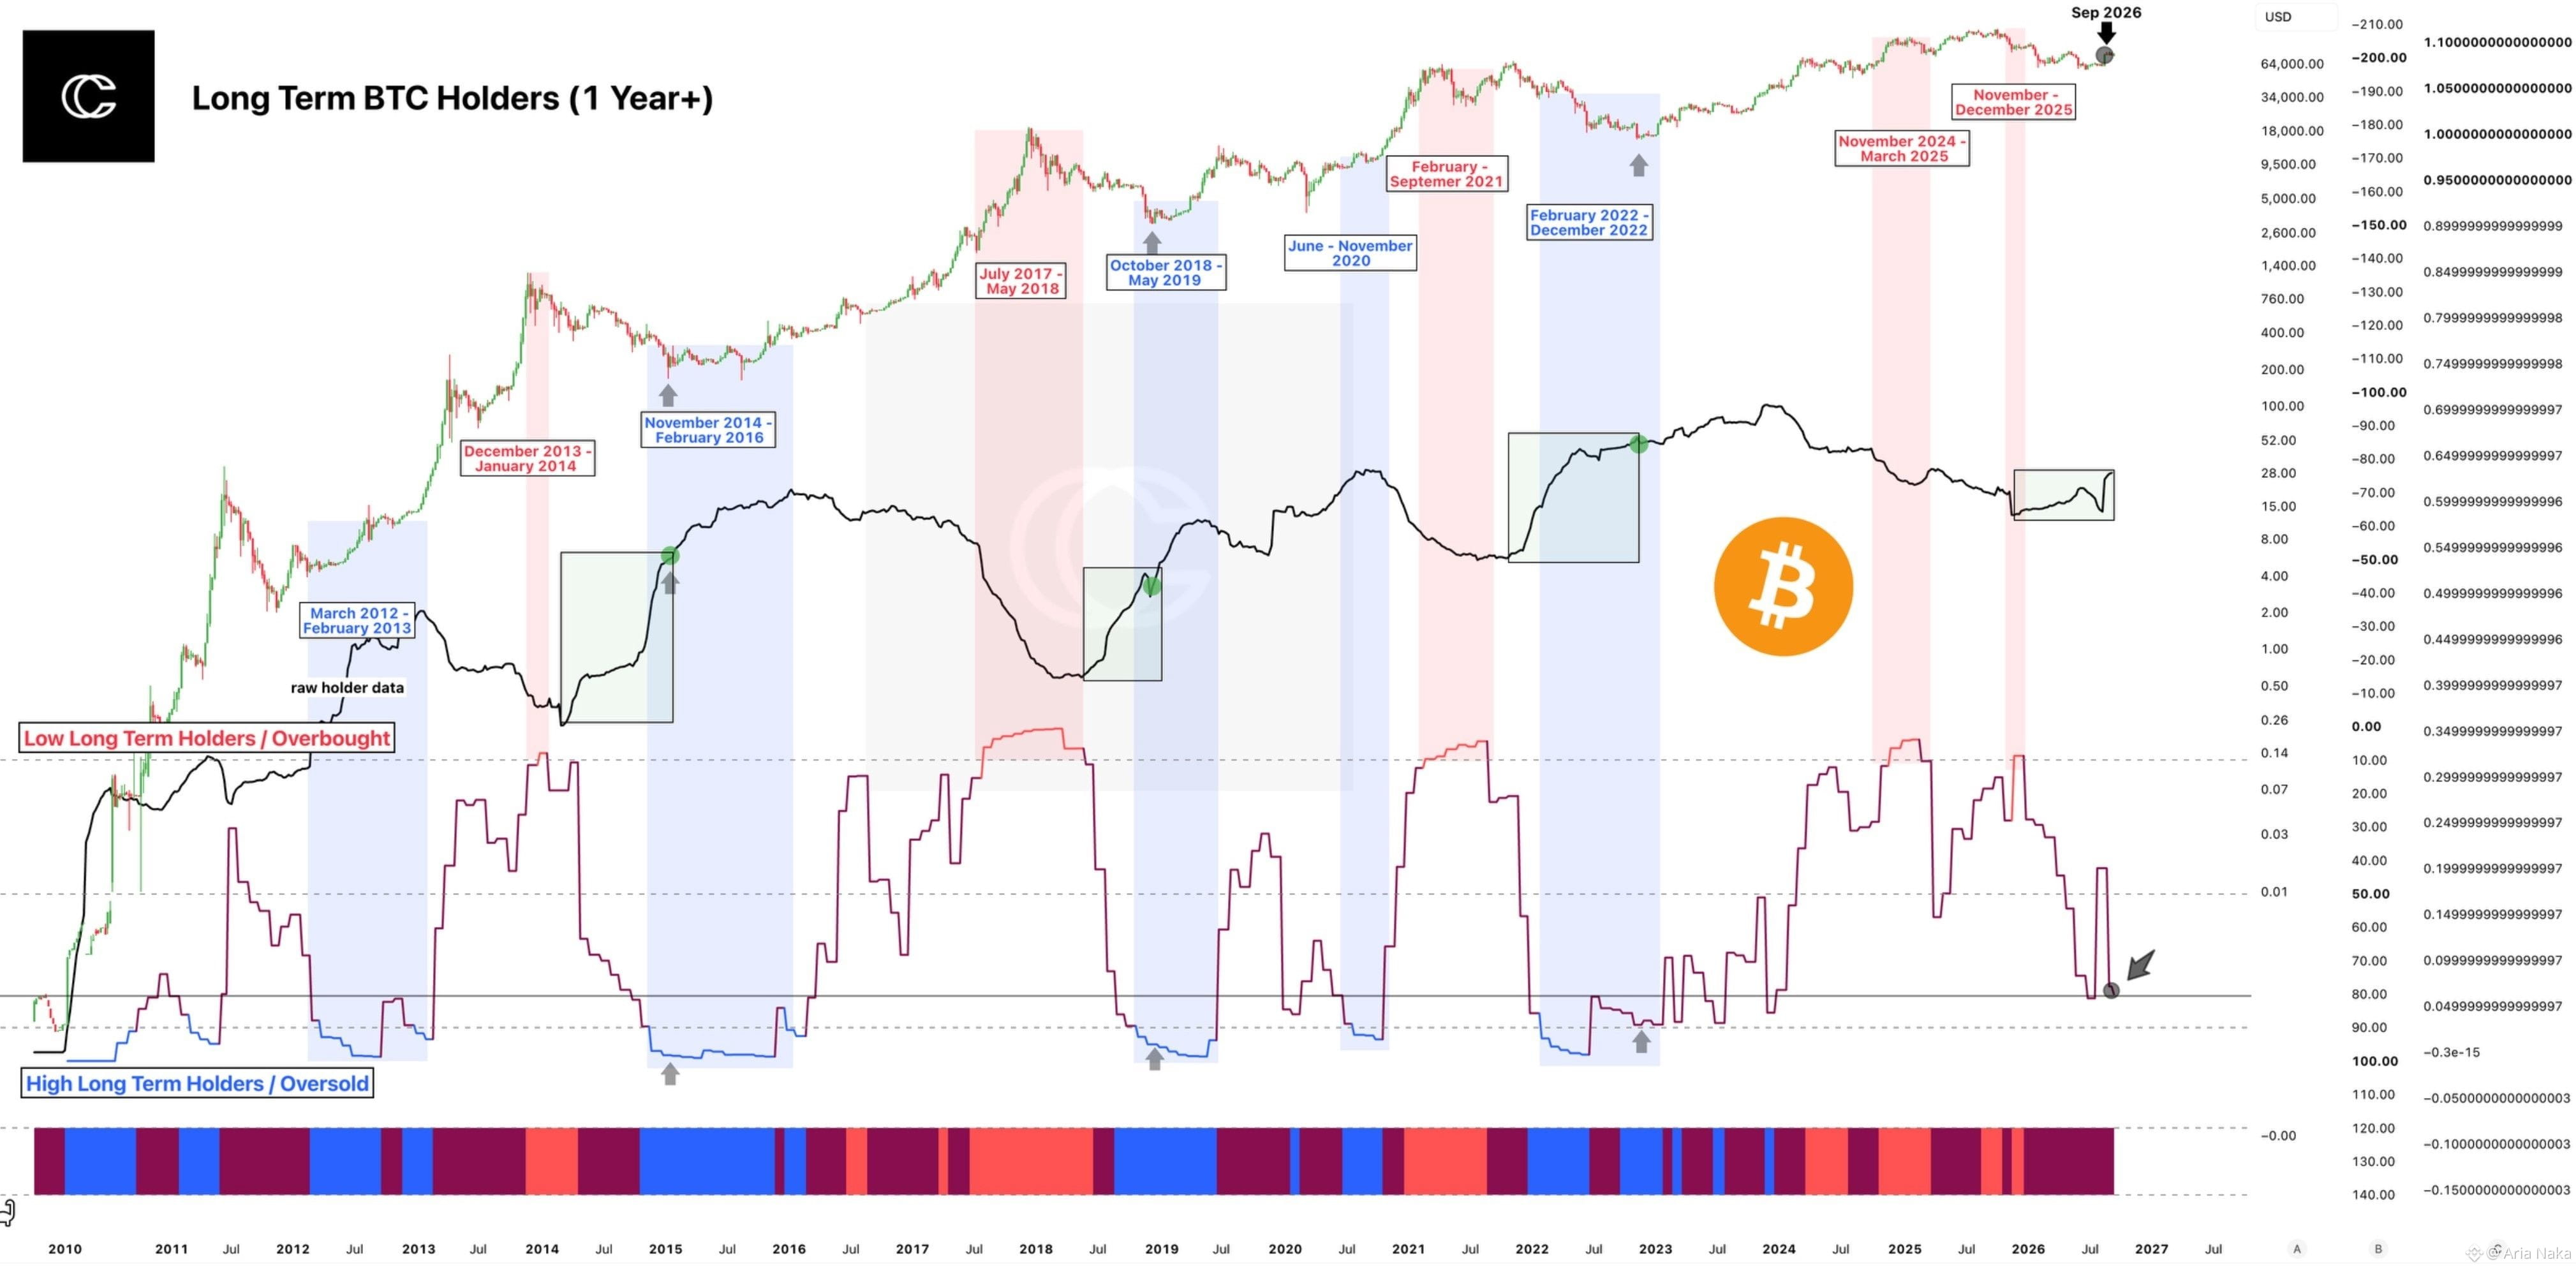
The 1 Year+ Long Term Holder structure is approaching a zone that has historically appeared near major accumulation and recovery phases. The current oscillator has pushed back toward the 80 to 90 area, while the raw holder data remains compressed near the lower end of its long term range, creating a setup that has repeatedly preceded a meaningful shift in BTC market structure.
Looking across previous cycles, similar conditions appeared around 2012 to 2013, 2014 to 2016, 2018 to 2019 and 2022 to 2023. In those periods, the indicator first reached an extreme, then the raw long term holder curve began turning upward, marking a transition from heavy distribution toward renewed accumulation.
The important signal now is the early recovery in the black holder curve. It is still far below the elevated levels seen during mature bull phases, but the recent turn suggests that the supply controlled by long term holders may be starting to rebuild after an extended period of redistribution. Historically, this type of reversal has been much more important than the absolute reading itself.
September 2026 is therefore becoming a critical structural checkpoint for $BTC. If the black curve continues rising while the oscillator moves away from the extreme zone, the current pattern could develop into another long term holder accumulation phase. A failure to confirm would weaken the signal, but sustained recovery could indicate that #Bitcoin is quietly entering another historically important transition zone.
#BTC Price Analysis# #Macro Insights#
The 1 Year+ Long Term Holder structure is approaching a zone that has historically appeared near major accumulation and recovery phases. The current oscillator has pushed back toward the 80 to 90 area, while the raw holder data remains compressed near the lower end of its long term range, creating a setup that has repeatedly preceded a meaningful shift in BTC market structure.
Looking across previous cycles, similar conditions appeared around 2012 to 2013, 2014 to 2016, 2018 to 2019 and 2022 to 2023. In those periods, the indicator first reached an extreme, then the raw long term holder curve began turning upward, marking a transition from heavy distribution toward renewed accumulation.
The important signal now is the early recovery in the black holder curve. It is still far below the elevated levels seen during mature bull phases, but the recent turn suggests that the supply controlled by long term holders may be starting to rebuild after an extended period of redistribution. Historically, this type of reversal has been much more important than the absolute reading itself.
September 2026 is therefore becoming a critical structural checkpoint for $BTC. If the black curve continues rising while the oscillator moves away from the extreme zone, the current pattern could develop into another long term holder accumulation phase. A failure to confirm would weaken the signal, but sustained recovery could indicate that #Bitcoin is quietly entering another historically important transition zone.
#BTC Price Analysis# #Macro Insights#