
MAYA_
41.2k Posts

MAYA_
 Square Verified+
Report
Block User
I am MAYA_ 👉 Spot, Futures And Alpha Trading Market Analyst 💫
Frequent Trader
4.1 Years
1.2K+ Following
51.3K+ Followers
206.7K+ Liked
Posts
All
Quotes
Videos
Live
·
--
Article
BITCOIN ADOPTION IS GROWING BUT THE MARKET IS STILL WAITING FOR ITS NEXT BIG MOVEHmm really.....
Have you noticed something interesting about the current Bitcoin situation? On one side, the market is carrying a masive amount of short exposure, while on the other side, traditional financial institutions are slowly becoming more comfortable with Bitcoin. And honestly, I think these two developments deserve attention.
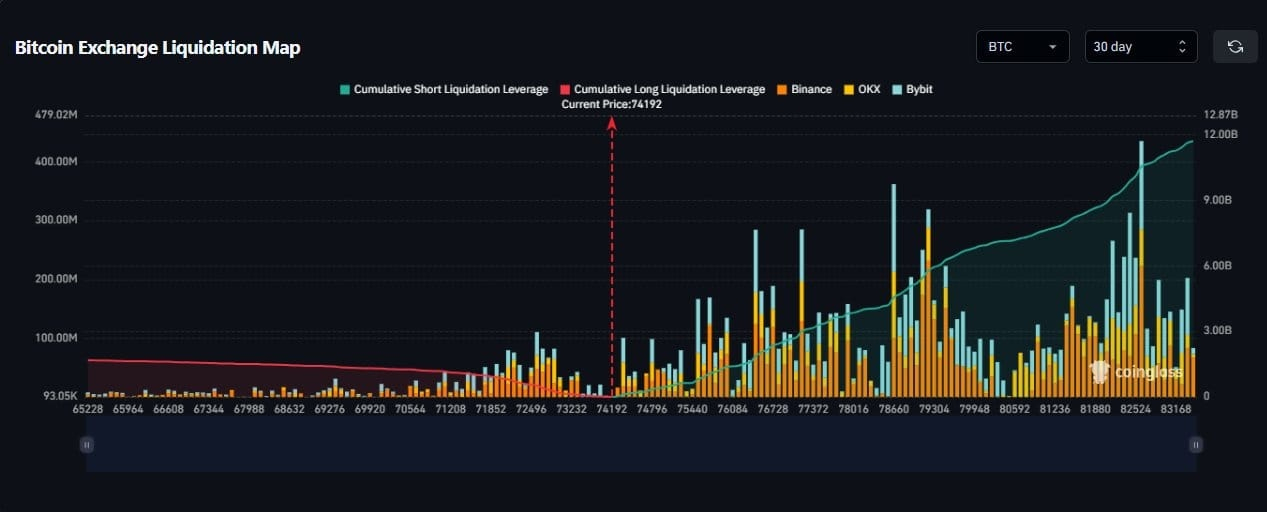
Hmm listen please, around $8.28 billion worth of short positions could face liquidation if BTC rises by just 10%. Think about that for a moment. A move of that size could put significant pressure on leveraged traders who are betting against Bitcoin. If price starts moving higher and short positions get liquidated, those forced buybacks could add further momentum to the move. That's where a short squeeze becomes interesting. Of course, it doesn't mean BTC will automatically pump 10%. The market still needs actual buying pressure and confirmation.
But, there's another development worth watching. Russia's central bank says stock exchanges can start Bitcoin trading on November 22. This is an interesting step because it brings Bitcoin closer to traditional financial market infrastructure. It also raises questions about how regulated access to crypto could evolve in different countries. And then we have Israel Discount Bank, reportedly preparing to become the first bank in Israel to allow customers to buy, hold and sell Bitcoin. That's another important sign of institutional adoption. When established banks begin offering direct access to Bitcoin, the relationship between traditional banking and crypto starts changing🤔
Personally, I think the bigger story here isn't just about the next BTC candle. It's about how Bitcoin is gradually finding its place inside the existing financial system. Still, adoption doesn't guarantee an imediate price increase. Short liquidations can create volatility, and institutional access takes time to translate into market demand. For now, I'm watching both sides: market positioning and realworld adoption. The combination is worth paying attention to, but confirmation still matters.....🤔
$BTC
BITCOIN ADOPTION IS GROWING BUT THE MARKET IS STILL WAITING FOR ITS NEXT BIG MOVE
Hmm really.....
Have you noticed something interesting about the current Bitcoin situation? On one side, the market is carrying a masive amount of short exposure, while on the other side, traditional financial institutions are slowly becoming more comfortable with Bitcoin. And honestly, I think these two developments deserve attention.
Hmm listen please, around $8.28 billion worth of short positions could face liquidation if BTC rises by just 10%. Think about that for a moment. A move of that size could put significant pressure on leveraged traders who are betting against Bitcoin. If price starts moving higher and short positions get liquidated, those forced buybacks could add further momentum to the move. That's where a short squeeze becomes interesting. Of course, it doesn't mean BTC will automatically pump 10%. The market still needs actual buying pressure and confirmation.
But, there's another development worth watching. Russia's central bank says stock exchanges can start Bitcoin trading on November 22. This is an interesting step because it brings Bitcoin closer to traditional financial market infrastructure. It also raises questions about how regulated access to crypto could evolve in different countries. And then we have Israel Discount Bank, reportedly preparing to become the first bank in Israel to allow customers to buy, hold and sell Bitcoin. That's another important sign of institutional adoption. When established banks begin offering direct access to Bitcoin, the relationship between traditional banking and crypto starts changing🤔
Personally, I think the bigger story here isn't just about the next BTC candle. It's about how Bitcoin is gradually finding its place inside the existing financial system. Still, adoption doesn't guarantee an imediate price increase. Short liquidations can create volatility, and institutional access takes time to translate into market demand. For now, I'm watching both sides: market positioning and realworld adoption. The combination is worth paying attention to, but confirmation still matters.....🤔
$BTC
Have you noticed something interesting about the current Bitcoin situation? On one side, the market is carrying a masive amount of short exposure, while on the other side, traditional financial institutions are slowly becoming more comfortable with Bitcoin. And honestly, I think these two developments deserve attention.
Hmm listen please, around $8.28 billion worth of short positions could face liquidation if BTC rises by just 10%. Think about that for a moment. A move of that size could put significant pressure on leveraged traders who are betting against Bitcoin. If price starts moving higher and short positions get liquidated, those forced buybacks could add further momentum to the move. That's where a short squeeze becomes interesting. Of course, it doesn't mean BTC will automatically pump 10%. The market still needs actual buying pressure and confirmation.
But, there's another development worth watching. Russia's central bank says stock exchanges can start Bitcoin trading on November 22. This is an interesting step because it brings Bitcoin closer to traditional financial market infrastructure. It also raises questions about how regulated access to crypto could evolve in different countries. And then we have Israel Discount Bank, reportedly preparing to become the first bank in Israel to allow customers to buy, hold and sell Bitcoin. That's another important sign of institutional adoption. When established banks begin offering direct access to Bitcoin, the relationship between traditional banking and crypto starts changing🤔
Personally, I think the bigger story here isn't just about the next BTC candle. It's about how Bitcoin is gradually finding its place inside the existing financial system. Still, adoption doesn't guarantee an imediate price increase. Short liquidations can create volatility, and institutional access takes time to translate into market demand. For now, I'm watching both sides: market positioning and realworld adoption. The combination is worth paying attention to, but confirmation still matters.....🤔
$BTC
2
310
·
--
Article
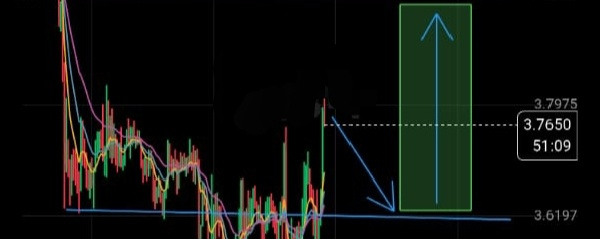
NEARUSDT a potential Recovery Is Taking Shape But Buyers Still Have Work To Do$NEAR is showing signs of a short-term recovery on the 1H chart after spending several sessions under corrective pressure. The price is currently trading around $3.7650, up 4.23%, with buyers attempting to regain control after defending the lower support region. What makes this setup interesting is that price has started moving above the short-term EMA cluster. However, I would not call this a confirmed trend reversal just yet. The broader structure still needs to overcome some important resistance levels
Current Price Action & Market Structure📊
looking at the recent structure, NEAR experienced a significant decline from the visible swing high near $4.1530 before finding buying interest around the $3.4420–$3.6197 region. Since then, price has been consolidating and attempting to build a recovery structure. important development is the recent move back toward $3.7650. Buyers are showing some strength, but the $3.7975–$3.8090 area is the immediate challenge. A convincing break above this region could open the door for another attempt toward $3.9752.
Here Is What the Indicators Are Suggesting
EMA structure is currently improving:
EMA 7: $3.6898
EMA 14: $3.6601
EMA 28: $3.6377
price is trading above all three EMAs, and their bullish alignment suggests improving short-term momentum. $3.6377–$3.6898 region could now act as dynamic support during a pullback
MACD is also supporting the recovery. DIF stands at 0.0265, DEA at 0.0124, and the histogram is positive at 0.0141. This indicates bullish momentum is currently developing, although continued expansion would make the signal more convincing
RSI readings are worth watching. RSI 6 is at 71.43, RSI 12 at 63.99, and RSI 24 at 58.11. The shortest RSI is already entering overbought territory. That doesn't automatically mean a reversal, but it does increase the possibility of a shortterm cooldown
Volume currently stands at 2.12M, compared with MA5 at 2.42M and MA10 at 1.79M. Participation is present, although the latest volume has not exceeded its five-period average.
Key Price Levels
Support:🟢
$3.6898 – Immediate EMA support.
$3.6197 – Important structural support.
$3.4420 – Recent major swinglow region.
Resistance:🔴
$3.7975–$3.8090 – Immediate resistance and 24H high area.
$3.9752 – Major recovery resistance.
$4.1530 – Previous visible swing high.
What Comes Next?
Bearish Scenario: If NEAR gets rejected around $3.7975–$3.8090 and loses the EMA cluster, sellers could push price back toward $3.6197. A breakdown below that level would weaken the recovery structure and potentially expose the $3.4420 region again
Bullish Scenario: If buyers secure a convincing 1H breakout above $3.8090, the next important area to watch will be $3.9752. Reclaiming that level would significantly improve the recovery outlook.
My Market Perspective✅
Personaly, I like the improvement in NEAR's short-term structure, especially the EMA alignment and positive MACD. But what concerns me is the elevated RSI 6 while price is approaching immediate resistance.
I would not rush into a long position after this upward move. I would rather watch whether price can hold above the EMA cluster during a potential pullback and then establish acceptance above $3.8090. For now, this looks more like an improving recovery attempt than a fully confirmed trend reversal. If support holds, buyers may get another opportunity. If it fails, patience becomes more important than chasing momentum.
market is volatile, so you have to manage your own risk.....🤔
Follow for more chart updates.
#AnthropicRejectsIPODelayValuationinQuestion #HotCPIDecemberHikePriced
NEARUSDT a potential Recovery Is Taking Shape But Buyers Still Have Work To Do
$NEAR is showing signs of a short-term recovery on the 1H chart after spending several sessions under corrective pressure. The price is currently trading around $3.7650, up 4.23%, with buyers attempting to regain control after defending the lower support region. What makes this setup interesting is that price has started moving above the short-term EMA cluster. However, I would not call this a confirmed trend reversal just yet. The broader structure still needs to overcome some important resistance levels
Current Price Action & Market Structure📊
looking at the recent structure, NEAR experienced a significant decline from the visible swing high near $4.1530 before finding buying interest around the $3.4420–$3.6197 region. Since then, price has been consolidating and attempting to build a recovery structure. important development is the recent move back toward $3.7650. Buyers are showing some strength, but the $3.7975–$3.8090 area is the immediate challenge. A convincing break above this region could open the door for another attempt toward $3.9752.
Here Is What the Indicators Are Suggesting
EMA structure is currently improving:
EMA 7: $3.6898
EMA 14: $3.6601
EMA 28: $3.6377
price is trading above all three EMAs, and their bullish alignment suggests improving short-term momentum. $3.6377–$3.6898 region could now act as dynamic support during a pullback
MACD is also supporting the recovery. DIF stands at 0.0265, DEA at 0.0124, and the histogram is positive at 0.0141. This indicates bullish momentum is currently developing, although continued expansion would make the signal more convincing
RSI readings are worth watching. RSI 6 is at 71.43, RSI 12 at 63.99, and RSI 24 at 58.11. The shortest RSI is already entering overbought territory. That doesn't automatically mean a reversal, but it does increase the possibility of a shortterm cooldown
Volume currently stands at 2.12M, compared with MA5 at 2.42M and MA10 at 1.79M. Participation is present, although the latest volume has not exceeded its five-period average.
Key Price Levels
Support:🟢
$3.6898 – Immediate EMA support.
$3.6197 – Important structural support.
$3.4420 – Recent major swinglow region.
Resistance:🔴
$3.7975–$3.8090 – Immediate resistance and 24H high area.
$3.9752 – Major recovery resistance.
$4.1530 – Previous visible swing high.
What Comes Next?
Bearish Scenario: If NEAR gets rejected around $3.7975–$3.8090 and loses the EMA cluster, sellers could push price back toward $3.6197. A breakdown below that level would weaken the recovery structure and potentially expose the $3.4420 region again
Bullish Scenario: If buyers secure a convincing 1H breakout above $3.8090, the next important area to watch will be $3.9752. Reclaiming that level would significantly improve the recovery outlook.
My Market Perspective✅
Personaly, I like the improvement in NEAR's short-term structure, especially the EMA alignment and positive MACD. But what concerns me is the elevated RSI 6 while price is approaching immediate resistance.
I would not rush into a long position after this upward move. I would rather watch whether price can hold above the EMA cluster during a potential pullback and then establish acceptance above $3.8090. For now, this looks more like an improving recovery attempt than a fully confirmed trend reversal. If support holds, buyers may get another opportunity. If it fails, patience becomes more important than chasing momentum.
market is volatile, so you have to manage your own risk.....🤔
Follow for more chart updates.
#AnthropicRejectsIPODelayValuationinQuestion #HotCPIDecemberHikePriced
Current Price Action & Market Structure📊
looking at the recent structure, NEAR experienced a significant decline from the visible swing high near $4.1530 before finding buying interest around the $3.4420–$3.6197 region. Since then, price has been consolidating and attempting to build a recovery structure. important development is the recent move back toward $3.7650. Buyers are showing some strength, but the $3.7975–$3.8090 area is the immediate challenge. A convincing break above this region could open the door for another attempt toward $3.9752.
Here Is What the Indicators Are Suggesting
EMA structure is currently improving:
EMA 7: $3.6898
EMA 14: $3.6601
EMA 28: $3.6377
price is trading above all three EMAs, and their bullish alignment suggests improving short-term momentum. $3.6377–$3.6898 region could now act as dynamic support during a pullback
MACD is also supporting the recovery. DIF stands at 0.0265, DEA at 0.0124, and the histogram is positive at 0.0141. This indicates bullish momentum is currently developing, although continued expansion would make the signal more convincing
RSI readings are worth watching. RSI 6 is at 71.43, RSI 12 at 63.99, and RSI 24 at 58.11. The shortest RSI is already entering overbought territory. That doesn't automatically mean a reversal, but it does increase the possibility of a shortterm cooldown
Volume currently stands at 2.12M, compared with MA5 at 2.42M and MA10 at 1.79M. Participation is present, although the latest volume has not exceeded its five-period average.
Key Price Levels
Support:🟢
$3.6898 – Immediate EMA support.
$3.6197 – Important structural support.
$3.4420 – Recent major swinglow region.
Resistance:🔴
$3.7975–$3.8090 – Immediate resistance and 24H high area.
$3.9752 – Major recovery resistance.
$4.1530 – Previous visible swing high.
What Comes Next?
Bearish Scenario: If NEAR gets rejected around $3.7975–$3.8090 and loses the EMA cluster, sellers could push price back toward $3.6197. A breakdown below that level would weaken the recovery structure and potentially expose the $3.4420 region again
Bullish Scenario: If buyers secure a convincing 1H breakout above $3.8090, the next important area to watch will be $3.9752. Reclaiming that level would significantly improve the recovery outlook.
My Market Perspective✅
Personaly, I like the improvement in NEAR's short-term structure, especially the EMA alignment and positive MACD. But what concerns me is the elevated RSI 6 while price is approaching immediate resistance.
I would not rush into a long position after this upward move. I would rather watch whether price can hold above the EMA cluster during a potential pullback and then establish acceptance above $3.8090. For now, this looks more like an improving recovery attempt than a fully confirmed trend reversal. If support holds, buyers may get another opportunity. If it fails, patience becomes more important than chasing momentum.
market is volatile, so you have to manage your own risk.....🤔
Follow for more chart updates.
#AnthropicRejectsIPODelayValuationinQuestion #HotCPIDecemberHikePriced
5
322
·
--
Article
Bulls vs. Bears battle at $73.5K, Important Position flip zone$BTC is atempting a Recovery But the 1H Trend Still Needs Confirmation.
Bitcoin is currently trading around $73,692.80, down approximately 0.96% on the displayed session. After a significant decline from the recent swing high near $81,181.10, BTC has entered a lower trading range, with sellers maintaining control of the broader short-term structure. However, the latest price action is worth watching. BTC recently tested the $72,686.60 low and started showing some recovery attempts. The question now is whether this is the beginning of a meaningful reversal or simply a temporary relief bounce within an existing bearish structure
Current Price Action📊
on the 1H timeframe, Bitcoin is still struggling to establish a convincing bullish structure. The previous downward movement created considerable selling pressure, and although buyers have stepped in near the recent low, price has not yet reclaimed the important overhead resistance levels. current price is also trading below all three visible EMAs, which suggests that short-term trend pressure remains slightly bearish
Here Is What the Indicators Are Suggesting
EMA Analysis:
EMA7: $73,744.93
EMA14: $73,753.34
EMA28: $73,915.18
BTC is currently below all three moving averages. The EMA7 and EMA14 are relatively close together, while EMA28 remains slightly higher. This creates an immediate resistance cluster around $73,745–$73,915. I want to see BTC reclaim this entire area before considering the recovery attempt stronger
MACD Analysis:
DIF: -144.38
DEA: -205.24
MACD: +60.85
there is an encouraging detail here. DIF is currently above DEA, and the displayed MACD histogram is positive. This suggests that bearish momentum may be weakening and short-term momentum is attempting to recover. However, both MACD lines remain below zero. An improving histogram is not the same as a confirmed bullish trend reversal
RSI Analysis:
RSI6: 47.76
RSI12: 46.88
RSI24: 45.42
All three RSI readings are below 50 but moving within neutral territory. This indicates that buyers have not established strong momentum yet. At the same time, BTC is not showing an extreme oversold reading on these indicators
Volume Analysis:
Current volume: 842.204
MA5: 1.39K
MA10: 1.45K
Current volume is below both volume averages. This is something I am paying attention to because the recovery attempt is not yet supported by strong trading participation.
Key Price Levels🎯
Support:🟢
$72,686.60 – Recent swing low and immediate structural support.
$73,000–$73,700 – Current trading area where buyers need to maintain stability.
Resistance:🔴
$73,745–$73,915 – Immediate EMA resistance cluster.
$74,810.22 – Important overhead price level.
$76,023.85–$76,963.27 – Higher recovery resistance area.
$79,170.48 – Major upside reference level if recovery develops further.
What Comes Next?
Bearish Scenario: If BTC loses $72,686.60, the recent recovery attempt could fail, potentially exposing Bitcoin to another downside expansion. A break below this swing low would weaken the current short-term structure further
Bullish Scenario: If buyers defend $72,686.60 and reclaim the $73,745–$73,915 EMA cluster, BTC could attempt a move toward $74,810.22. A convincing move above that level would make the recovery considerably more interesting
My Market Perspective✅
personally, I am not ready to call this a bullish reversal yet. The MACD improvement is encouraging, but the EMA structure and relatively weak volume are still reasons to remain cautious. What concerns me most is that Bitcoin has recovered from its recent low without reclaiming the important moving averages. I would rather wait for a proper resistance reclaim and stronger volume confirmation than chase a small bounce. For now, my main focus remains on $72,686.60 as the critical support and $73,745–$73,915 as the first recovery hurdle.
I would avoid forcing an entry in the middle of this uncertain structure. If support holds, I will watch for confirmation. If it breaks, I will reassess the downside risk rather than blindly average into a losing position
market is volatile, so you have to manage your own risk....👍
#BitcoinFiveWeeklyLosses #StrategyFaces$2.8BSelloffRiskFromMSCIRemoval #AnthropicRejectsIPODelayValuationinQuestion
Bulls vs. Bears battle at $73.5K, Important Position flip zone
$BTC is atempting a Recovery But the 1H Trend Still Needs Confirmation.
Bitcoin is currently trading around $73,692.80, down approximately 0.96% on the displayed session. After a significant decline from the recent swing high near $81,181.10, BTC has entered a lower trading range, with sellers maintaining control of the broader short-term structure. However, the latest price action is worth watching. BTC recently tested the $72,686.60 low and started showing some recovery attempts. The question now is whether this is the beginning of a meaningful reversal or simply a temporary relief bounce within an existing bearish structure
Current Price Action📊
on the 1H timeframe, Bitcoin is still struggling to establish a convincing bullish structure. The previous downward movement created considerable selling pressure, and although buyers have stepped in near the recent low, price has not yet reclaimed the important overhead resistance levels. current price is also trading below all three visible EMAs, which suggests that short-term trend pressure remains slightly bearish
Here Is What the Indicators Are Suggesting
EMA Analysis:
EMA7: $73,744.93
EMA14: $73,753.34
EMA28: $73,915.18
BTC is currently below all three moving averages. The EMA7 and EMA14 are relatively close together, while EMA28 remains slightly higher. This creates an immediate resistance cluster around $73,745–$73,915. I want to see BTC reclaim this entire area before considering the recovery attempt stronger
MACD Analysis:
DIF: -144.38
DEA: -205.24
MACD: +60.85
there is an encouraging detail here. DIF is currently above DEA, and the displayed MACD histogram is positive. This suggests that bearish momentum may be weakening and short-term momentum is attempting to recover. However, both MACD lines remain below zero. An improving histogram is not the same as a confirmed bullish trend reversal
RSI Analysis:
RSI6: 47.76
RSI12: 46.88
RSI24: 45.42
All three RSI readings are below 50 but moving within neutral territory. This indicates that buyers have not established strong momentum yet. At the same time, BTC is not showing an extreme oversold reading on these indicators
Volume Analysis:
Current volume: 842.204
MA5: 1.39K
MA10: 1.45K
Current volume is below both volume averages. This is something I am paying attention to because the recovery attempt is not yet supported by strong trading participation.
Key Price Levels🎯
Support:🟢
$72,686.60 – Recent swing low and immediate structural support.
$73,000–$73,700 – Current trading area where buyers need to maintain stability.
Resistance:🔴
$73,745–$73,915 – Immediate EMA resistance cluster.
$74,810.22 – Important overhead price level.
$76,023.85–$76,963.27 – Higher recovery resistance area.
$79,170.48 – Major upside reference level if recovery develops further.
What Comes Next?
Bearish Scenario: If BTC loses $72,686.60, the recent recovery attempt could fail, potentially exposing Bitcoin to another downside expansion. A break below this swing low would weaken the current short-term structure further
Bullish Scenario: If buyers defend $72,686.60 and reclaim the $73,745–$73,915 EMA cluster, BTC could attempt a move toward $74,810.22. A convincing move above that level would make the recovery considerably more interesting
My Market Perspective✅
personally, I am not ready to call this a bullish reversal yet. The MACD improvement is encouraging, but the EMA structure and relatively weak volume are still reasons to remain cautious. What concerns me most is that Bitcoin has recovered from its recent low without reclaiming the important moving averages. I would rather wait for a proper resistance reclaim and stronger volume confirmation than chase a small bounce. For now, my main focus remains on $72,686.60 as the critical support and $73,745–$73,915 as the first recovery hurdle.
I would avoid forcing an entry in the middle of this uncertain structure. If support holds, I will watch for confirmation. If it breaks, I will reassess the downside risk rather than blindly average into a losing position
market is volatile, so you have to manage your own risk....👍
#BitcoinFiveWeeklyLosses #StrategyFaces$2.8BSelloffRiskFromMSCIRemoval #AnthropicRejectsIPODelayValuationinQuestion
Bitcoin is currently trading around $73,692.80, down approximately 0.96% on the displayed session. After a significant decline from the recent swing high near $81,181.10, BTC has entered a lower trading range, with sellers maintaining control of the broader short-term structure. However, the latest price action is worth watching. BTC recently tested the $72,686.60 low and started showing some recovery attempts. The question now is whether this is the beginning of a meaningful reversal or simply a temporary relief bounce within an existing bearish structure
Current Price Action📊
on the 1H timeframe, Bitcoin is still struggling to establish a convincing bullish structure. The previous downward movement created considerable selling pressure, and although buyers have stepped in near the recent low, price has not yet reclaimed the important overhead resistance levels. current price is also trading below all three visible EMAs, which suggests that short-term trend pressure remains slightly bearish
Here Is What the Indicators Are Suggesting
EMA Analysis:
EMA7: $73,744.93
EMA14: $73,753.34
EMA28: $73,915.18
BTC is currently below all three moving averages. The EMA7 and EMA14 are relatively close together, while EMA28 remains slightly higher. This creates an immediate resistance cluster around $73,745–$73,915. I want to see BTC reclaim this entire area before considering the recovery attempt stronger
MACD Analysis:
DIF: -144.38
DEA: -205.24
MACD: +60.85
there is an encouraging detail here. DIF is currently above DEA, and the displayed MACD histogram is positive. This suggests that bearish momentum may be weakening and short-term momentum is attempting to recover. However, both MACD lines remain below zero. An improving histogram is not the same as a confirmed bullish trend reversal
RSI Analysis:
RSI6: 47.76
RSI12: 46.88
RSI24: 45.42
All three RSI readings are below 50 but moving within neutral territory. This indicates that buyers have not established strong momentum yet. At the same time, BTC is not showing an extreme oversold reading on these indicators
Volume Analysis:
Current volume: 842.204
MA5: 1.39K
MA10: 1.45K
Current volume is below both volume averages. This is something I am paying attention to because the recovery attempt is not yet supported by strong trading participation.
Key Price Levels🎯
Support:🟢
$72,686.60 – Recent swing low and immediate structural support.
$73,000–$73,700 – Current trading area where buyers need to maintain stability.
Resistance:🔴
$73,745–$73,915 – Immediate EMA resistance cluster.
$74,810.22 – Important overhead price level.
$76,023.85–$76,963.27 – Higher recovery resistance area.
$79,170.48 – Major upside reference level if recovery develops further.
What Comes Next?
Bearish Scenario: If BTC loses $72,686.60, the recent recovery attempt could fail, potentially exposing Bitcoin to another downside expansion. A break below this swing low would weaken the current short-term structure further
Bullish Scenario: If buyers defend $72,686.60 and reclaim the $73,745–$73,915 EMA cluster, BTC could attempt a move toward $74,810.22. A convincing move above that level would make the recovery considerably more interesting
My Market Perspective✅
personally, I am not ready to call this a bullish reversal yet. The MACD improvement is encouraging, but the EMA structure and relatively weak volume are still reasons to remain cautious. What concerns me most is that Bitcoin has recovered from its recent low without reclaiming the important moving averages. I would rather wait for a proper resistance reclaim and stronger volume confirmation than chase a small bounce. For now, my main focus remains on $72,686.60 as the critical support and $73,745–$73,915 as the first recovery hurdle.
I would avoid forcing an entry in the middle of this uncertain structure. If support holds, I will watch for confirmation. If it breaks, I will reassess the downside risk rather than blindly average into a losing position
market is volatile, so you have to manage your own risk....👍
#BitcoinFiveWeeklyLosses #StrategyFaces$2.8BSelloffRiskFromMSCIRemoval #AnthropicRejectsIPODelayValuationinQuestion
1
11
1k
·
--

Article
INJ UPDATE$INJ USDT is showing a constructive bullish recovery on the 1H timeframe, and I am watching this setup closely. After dropping toward $7.6540, buyers stepped in aggressively and pushed the price back toward $8.4420. That recovery is important, but what interests me more now is whether buyers can defend the current consolidation instead of allowing another deeper pullback......👍 Curently, INJ is trading around $8.2240, up 1.44%. Price has recovered strongly from its recent swing low and is now holding near the short-term EMA cluster.
Technical Analysis:📊
EMA structure is encouraging. EMA7 is at $8.2232, EMA14 at $8.1682 and EMA28 at $8.1168. Price is trading around EMA7 and above the other two averages, suggesting that short-term buyers still have some control
RSI is also supporting the recovery. RSI6 stands at 55.08, RSI12 at 55.71, and RSI24 at 53.62. This shows moderately positive momentum without an obvious overbought condition
MACD is another interesting part of this chart. DIF is at 0.0613, DEA at 0.0366, and the histogram is positive at 0.0247. Momentum currently favors the bulls, although I want to see whether it can sustain this strength
Volume is around 153.18K, above both MA5 at 134.89K and MA10 at 114.11K. That gives the recovery some additional support
My Entry Strategy:🎯
I am watching the $8.10–$8.17 area as a potential pullback zone because it aligns with EMA14 and EMA28. I would prefer to see buyers defend this area with a bullish candle and improving volume before considering an entry.
My DCA Strategy:✅
I am not rushing into multiple entries at the current price. If price pulls back toward the EMA support cluster, I may consider scaling in gradually, provided the bullish structure remains intact. I don't want to average down if support starts breaking.
Targets and Risk Management:⚠️
The first important resistance is $8.4420, the recent swing high. A clean breakout and sustained hold above that level would strengthen the continuation setup, but I don't see enough chart information to assign reliable TP2 or TP3 levels.
my broader invalidation reference is the $7.6540 swing low. Position size and stop placement should account for the distance to structural invalidation...... For now, I like the recovery, but I am not blindly chasing green candles. I would rather wait for a clean retest than enter emotionally. Let buyers prove that this recovery has more room to run.....🤔
market is volatile, so you have to manage your own risk
#AnthropicRejectsIPODelayValuationinQuestion #HotCPIDecemberHikePriced #BitcoinFiveWeeklyLosses
INJ UPDATE
$INJ USDT is showing a constructive bullish recovery on the 1H timeframe, and I am watching this setup closely. After dropping toward $7.6540, buyers stepped in aggressively and pushed the price back toward $8.4420. That recovery is important, but what interests me more now is whether buyers can defend the current consolidation instead of allowing another deeper pullback......👍 Curently, INJ is trading around $8.2240, up 1.44%. Price has recovered strongly from its recent swing low and is now holding near the short-term EMA cluster.
Technical Analysis:📊
EMA structure is encouraging. EMA7 is at $8.2232, EMA14 at $8.1682 and EMA28 at $8.1168. Price is trading around EMA7 and above the other two averages, suggesting that short-term buyers still have some control
RSI is also supporting the recovery. RSI6 stands at 55.08, RSI12 at 55.71, and RSI24 at 53.62. This shows moderately positive momentum without an obvious overbought condition
MACD is another interesting part of this chart. DIF is at 0.0613, DEA at 0.0366, and the histogram is positive at 0.0247. Momentum currently favors the bulls, although I want to see whether it can sustain this strength
Volume is around 153.18K, above both MA5 at 134.89K and MA10 at 114.11K. That gives the recovery some additional support
My Entry Strategy:🎯
I am watching the $8.10–$8.17 area as a potential pullback zone because it aligns with EMA14 and EMA28. I would prefer to see buyers defend this area with a bullish candle and improving volume before considering an entry.
My DCA Strategy:✅
I am not rushing into multiple entries at the current price. If price pulls back toward the EMA support cluster, I may consider scaling in gradually, provided the bullish structure remains intact. I don't want to average down if support starts breaking.
Targets and Risk Management:⚠️
The first important resistance is $8.4420, the recent swing high. A clean breakout and sustained hold above that level would strengthen the continuation setup, but I don't see enough chart information to assign reliable TP2 or TP3 levels.
my broader invalidation reference is the $7.6540 swing low. Position size and stop placement should account for the distance to structural invalidation...... For now, I like the recovery, but I am not blindly chasing green candles. I would rather wait for a clean retest than enter emotionally. Let buyers prove that this recovery has more room to run.....🤔
market is volatile, so you have to manage your own risk
#AnthropicRejectsIPODelayValuationinQuestion #HotCPIDecemberHikePriced #BitcoinFiveWeeklyLosses
Technical Analysis:📊
EMA structure is encouraging. EMA7 is at $8.2232, EMA14 at $8.1682 and EMA28 at $8.1168. Price is trading around EMA7 and above the other two averages, suggesting that short-term buyers still have some control
RSI is also supporting the recovery. RSI6 stands at 55.08, RSI12 at 55.71, and RSI24 at 53.62. This shows moderately positive momentum without an obvious overbought condition
MACD is another interesting part of this chart. DIF is at 0.0613, DEA at 0.0366, and the histogram is positive at 0.0247. Momentum currently favors the bulls, although I want to see whether it can sustain this strength
Volume is around 153.18K, above both MA5 at 134.89K and MA10 at 114.11K. That gives the recovery some additional support
My Entry Strategy:🎯
I am watching the $8.10–$8.17 area as a potential pullback zone because it aligns with EMA14 and EMA28. I would prefer to see buyers defend this area with a bullish candle and improving volume before considering an entry.
My DCA Strategy:✅
I am not rushing into multiple entries at the current price. If price pulls back toward the EMA support cluster, I may consider scaling in gradually, provided the bullish structure remains intact. I don't want to average down if support starts breaking.
Targets and Risk Management:⚠️
The first important resistance is $8.4420, the recent swing high. A clean breakout and sustained hold above that level would strengthen the continuation setup, but I don't see enough chart information to assign reliable TP2 or TP3 levels.
my broader invalidation reference is the $7.6540 swing low. Position size and stop placement should account for the distance to structural invalidation...... For now, I like the recovery, but I am not blindly chasing green candles. I would rather wait for a clean retest than enter emotionally. Let buyers prove that this recovery has more room to run.....🤔
market is volatile, so you have to manage your own risk
#AnthropicRejectsIPODelayValuationinQuestion #HotCPIDecemberHikePriced #BitcoinFiveWeeklyLosses
1
8
368
·
--

Article
$PEPE/USDT : navigating the Golden Pocket Retracement ZoneHmm......
I am currently keeping a close eye on $PEPE USDT on the 1-hour timeframe as price tests a fascinating technical confluence zone. After a sharp impulse move up to a swing high around 0.0057876, the sset has experienced a measured pullback, bringing current price action right into a critical reaction area that deserves our attention
Price Action & Technical Read
Looking at the chart, price has retraced from the 0.0 stroke down and is currently hovering around 0.0053230
Fibonacci Retracement: The pullback is currently interacting heavily with the Fibonacci levels plotted from the recent swing. Price has slipped past the 0.236 (0.0056886), 0.382 (0.0056274), and 0.5 (0.0055778) levels, and is now testing right around the 0.618 golden pocket level (0.0055283) to the 0.786 level (0.0054578) depending on how you view the wick action, currently trading slightly below at 0.0053230
EMAs: The EMA ribbon (EMA7 at 0.0052938, EMA14 at 0.0052451, and EMA28 at 0.0051862) is tightly bunched just below the current price, indicating that short-term moving averages are acting as a dynamic support floor following the recent cooling off
Momentum & RSI: RSI(6) is sitting at 69.39, RSI(12) at 64.77, and RSI(24) at 60.33, showing that momentum has cooled off from overbought extremes while still maintaining a generally resilient posture. Meanwhile, MACD (DIF: 0.0000633, DEA: 0.0000481, MACD: 0.0000152) shows a modest positive histogram, though momentum remains relatively flat as it consolidates
Why This Setup Matters
zone is interesting because the pullback into the lower Fibonacci retracement levels provides a classic bullish continuation setup if buyers can step in and defend the EMA cluster. However, because we have broken below the immediate 0.618 level, I want to see if the lower structural supports (closer to the 1.0 Fibonacci anchor around 0.003680 or intermediate swing structures) will hold firm before committing capital. It's a classic battle between a healthy correction in an uptrend versus a deeper mean reversion
Execution Strategy & Risk Management
Entry Zone: I am watching the 0.005150 – 0.005300 region where the EMA lines converge for signs of a bullish reaction or reversal candlestick pattern
DCA Levels: If the pullback deepens, I am eyeing secondary accumulation zones near the 0.0046891 level (marked by the previous 2.618 extension/support structure) if market breadth weakens
Stop Loss: A clean invalidation would sit below the recent local swing low structure underneath the EMA28 to protect against a broader trend breakdown
TP1: 0.0055778 (matching the 0.5 Fib retracement level).
TP2: 0.0056886 (the 0.236 level).
TP3: 0.0057876 (retest of the swing high, 0.0 level).
Personal Trading Perspective
My personal read is that while the trend structure still shows higher highs and higher lows on this timeframe, rushing into a long right in the middle of a downward corrective leg can be a trap. I prefer to wait for confirmation...... either a strong bounce off the EMA support or a retest of lower liquidity. Markets owe us nothing, and this setup can easily fail if broader crypto sentiment dips
What is your game plan for PEPE here—are you looking to catch the dip at these levels, or waiting for a deeper correction down to major support? Let's discuss below! 👇👇👇
#CPITestsDecemberRateOutlook
$PEPE/USDT : navigating the Golden Pocket Retracement Zone
Hmm......
I am currently keeping a close eye on $PEPE USDT on the 1-hour timeframe as price tests a fascinating technical confluence zone. After a sharp impulse move up to a swing high around 0.0057876, the sset has experienced a measured pullback, bringing current price action right into a critical reaction area that deserves our attention
Price Action & Technical Read
Looking at the chart, price has retraced from the 0.0 stroke down and is currently hovering around 0.0053230
Fibonacci Retracement: The pullback is currently interacting heavily with the Fibonacci levels plotted from the recent swing. Price has slipped past the 0.236 (0.0056886), 0.382 (0.0056274), and 0.5 (0.0055778) levels, and is now testing right around the 0.618 golden pocket level (0.0055283) to the 0.786 level (0.0054578) depending on how you view the wick action, currently trading slightly below at 0.0053230
EMAs: The EMA ribbon (EMA7 at 0.0052938, EMA14 at 0.0052451, and EMA28 at 0.0051862) is tightly bunched just below the current price, indicating that short-term moving averages are acting as a dynamic support floor following the recent cooling off
Momentum & RSI: RSI(6) is sitting at 69.39, RSI(12) at 64.77, and RSI(24) at 60.33, showing that momentum has cooled off from overbought extremes while still maintaining a generally resilient posture. Meanwhile, MACD (DIF: 0.0000633, DEA: 0.0000481, MACD: 0.0000152) shows a modest positive histogram, though momentum remains relatively flat as it consolidates
Why This Setup Matters
zone is interesting because the pullback into the lower Fibonacci retracement levels provides a classic bullish continuation setup if buyers can step in and defend the EMA cluster. However, because we have broken below the immediate 0.618 level, I want to see if the lower structural supports (closer to the 1.0 Fibonacci anchor around 0.003680 or intermediate swing structures) will hold firm before committing capital. It's a classic battle between a healthy correction in an uptrend versus a deeper mean reversion
Execution Strategy & Risk Management
Entry Zone: I am watching the 0.005150 – 0.005300 region where the EMA lines converge for signs of a bullish reaction or reversal candlestick pattern
DCA Levels: If the pullback deepens, I am eyeing secondary accumulation zones near the 0.0046891 level (marked by the previous 2.618 extension/support structure) if market breadth weakens
Stop Loss: A clean invalidation would sit below the recent local swing low structure underneath the EMA28 to protect against a broader trend breakdown
TP1: 0.0055778 (matching the 0.5 Fib retracement level).
TP2: 0.0056886 (the 0.236 level).
TP3: 0.0057876 (retest of the swing high, 0.0 level).
Personal Trading Perspective
My personal read is that while the trend structure still shows higher highs and higher lows on this timeframe, rushing into a long right in the middle of a downward corrective leg can be a trap. I prefer to wait for confirmation...... either a strong bounce off the EMA support or a retest of lower liquidity. Markets owe us nothing, and this setup can easily fail if broader crypto sentiment dips
What is your game plan for PEPE here—are you looking to catch the dip at these levels, or waiting for a deeper correction down to major support? Let's discuss below! 👇👇👇
#CPITestsDecemberRateOutlook
I am currently keeping a close eye on $PEPE USDT on the 1-hour timeframe as price tests a fascinating technical confluence zone. After a sharp impulse move up to a swing high around 0.0057876, the sset has experienced a measured pullback, bringing current price action right into a critical reaction area that deserves our attention
Price Action & Technical Read
Looking at the chart, price has retraced from the 0.0 stroke down and is currently hovering around 0.0053230
Fibonacci Retracement: The pullback is currently interacting heavily with the Fibonacci levels plotted from the recent swing. Price has slipped past the 0.236 (0.0056886), 0.382 (0.0056274), and 0.5 (0.0055778) levels, and is now testing right around the 0.618 golden pocket level (0.0055283) to the 0.786 level (0.0054578) depending on how you view the wick action, currently trading slightly below at 0.0053230
EMAs: The EMA ribbon (EMA7 at 0.0052938, EMA14 at 0.0052451, and EMA28 at 0.0051862) is tightly bunched just below the current price, indicating that short-term moving averages are acting as a dynamic support floor following the recent cooling off
Momentum & RSI: RSI(6) is sitting at 69.39, RSI(12) at 64.77, and RSI(24) at 60.33, showing that momentum has cooled off from overbought extremes while still maintaining a generally resilient posture. Meanwhile, MACD (DIF: 0.0000633, DEA: 0.0000481, MACD: 0.0000152) shows a modest positive histogram, though momentum remains relatively flat as it consolidates
Why This Setup Matters
zone is interesting because the pullback into the lower Fibonacci retracement levels provides a classic bullish continuation setup if buyers can step in and defend the EMA cluster. However, because we have broken below the immediate 0.618 level, I want to see if the lower structural supports (closer to the 1.0 Fibonacci anchor around 0.003680 or intermediate swing structures) will hold firm before committing capital. It's a classic battle between a healthy correction in an uptrend versus a deeper mean reversion
Execution Strategy & Risk Management
Entry Zone: I am watching the 0.005150 – 0.005300 region where the EMA lines converge for signs of a bullish reaction or reversal candlestick pattern
DCA Levels: If the pullback deepens, I am eyeing secondary accumulation zones near the 0.0046891 level (marked by the previous 2.618 extension/support structure) if market breadth weakens
Stop Loss: A clean invalidation would sit below the recent local swing low structure underneath the EMA28 to protect against a broader trend breakdown
TP1: 0.0055778 (matching the 0.5 Fib retracement level).
TP2: 0.0056886 (the 0.236 level).
TP3: 0.0057876 (retest of the swing high, 0.0 level).
Personal Trading Perspective
My personal read is that while the trend structure still shows higher highs and higher lows on this timeframe, rushing into a long right in the middle of a downward corrective leg can be a trap. I prefer to wait for confirmation...... either a strong bounce off the EMA support or a retest of lower liquidity. Markets owe us nothing, and this setup can easily fail if broader crypto sentiment dips
What is your game plan for PEPE here—are you looking to catch the dip at these levels, or waiting for a deeper correction down to major support? Let's discuss below! 👇👇👇
#CPITestsDecemberRateOutlook
1
12
897
·
--

Article
BITCOIN UPDATE 🟢$BTC USDT is approaching an important decision zone on the 1H timeframe. Bitcoin is currently trading around $74,649, and although buyers have managed to stabilize price after the recent sharp decline, I am not seeing a fully confirmed bullish reversal just yet💥
Price Action & Market Structure
looking at the chart, BTC previously pushed toward the $81,181 region before experiencing a strong sell-off. That move changed the short-term structure, with price losing several support areas and eventually dropping toward the $73,700–$73,400 region
since that decline, Bitcoin has been moving sideways and attempting to build a local base. Buyers are showing some interest around the lower range, but the recovery still looks relatively weak
immediate question is whether this consolidation is an accumulation phase before another recovery or simply a temporary pause in the broader downward move
Technical Indicators📊
EMA structure is something I am paying close attention to
EMA 7 is at $74,783.98, EMA 14 at $74,833.33, and EMA 28 at $74,904.96. All three are currently above the market price. This means BTC needs to reclaim the $74,800–$74,950 area before I become more confident about short-term bullish momentum
RSI is also showing a relatively weak position. RSI 6 is around 39.99, RSI 12 is 45.04, and RSI 24 is 45.62. Momentum is recovering slightly from weaker conditions, but buyers have not established strong control yet
MACD remains negative, with DIF at -65.59, DEA at -55.34, and a histogram reading of -10.25. This suggests bearish momentum has not completely disappeared.
volume is another thing worth watching. Current volume is approximately 727.479, below both the MA5 of 1.42K and MA10 of 1.38K. The recovery is therefore not yet supported by particularly strong trading activity
My Trading Plan🙋♀️
I am watching two important areas:
Support: $73,700–$73,400
Immediate resistance: $74,800–$74,950
A successful reclaim of the EMA cluster could open the door for a recovery toward these levels:
TP1: $75,555
TP2: $77,290
TP3: $79,235
$79,235 region is particularly interesting because it is also marked as an upper resistance area on the chart.
For a potential long setup, I would rather see price hold the $73,700–$74,000 support region and reclaim the EMA cluster before considering an entry. I would avoid blindly averaging down while momentum remains weak
A sustained move below $73,400 would invalidate this short-term bullish recovery idea. I would reassess the setup rather than force a trade
My Personal Perspective✅
I am cautiously watching BTC here. The market has already experienced a significant decline, so a relief recovery is possible, but that doesn't automatically mean the bottom is confirmed
I don't want to chase a green candle without confirmation. First, I want to see buyers reclaim short-term resistance with stronger volume
what do you think? Can Bitcoin recover toward $79K from this consolidation, or are we likely to see another retest of $73K first?
market is volatile, so you have to manage your own risk....👍
#CPITestsDecemberRateOutlook #BitcoinFiveWeeklyLosses #BitcoinSpotETFsPost$201MNetOutflowForThirdStraightDay #StrategyBuys1037BTCLastWeek
BITCOIN UPDATE 🟢
$BTC USDT is approaching an important decision zone on the 1H timeframe. Bitcoin is currently trading around $74,649, and although buyers have managed to stabilize price after the recent sharp decline, I am not seeing a fully confirmed bullish reversal just yet💥
Price Action & Market Structure
looking at the chart, BTC previously pushed toward the $81,181 region before experiencing a strong sell-off. That move changed the short-term structure, with price losing several support areas and eventually dropping toward the $73,700–$73,400 region
since that decline, Bitcoin has been moving sideways and attempting to build a local base. Buyers are showing some interest around the lower range, but the recovery still looks relatively weak
immediate question is whether this consolidation is an accumulation phase before another recovery or simply a temporary pause in the broader downward move
Technical Indicators📊
EMA structure is something I am paying close attention to
EMA 7 is at $74,783.98, EMA 14 at $74,833.33, and EMA 28 at $74,904.96. All three are currently above the market price. This means BTC needs to reclaim the $74,800–$74,950 area before I become more confident about short-term bullish momentum
RSI is also showing a relatively weak position. RSI 6 is around 39.99, RSI 12 is 45.04, and RSI 24 is 45.62. Momentum is recovering slightly from weaker conditions, but buyers have not established strong control yet
MACD remains negative, with DIF at -65.59, DEA at -55.34, and a histogram reading of -10.25. This suggests bearish momentum has not completely disappeared.
volume is another thing worth watching. Current volume is approximately 727.479, below both the MA5 of 1.42K and MA10 of 1.38K. The recovery is therefore not yet supported by particularly strong trading activity
My Trading Plan🙋♀️
I am watching two important areas:
Support: $73,700–$73,400
Immediate resistance: $74,800–$74,950
A successful reclaim of the EMA cluster could open the door for a recovery toward these levels:
TP1: $75,555
TP2: $77,290
TP3: $79,235
$79,235 region is particularly interesting because it is also marked as an upper resistance area on the chart.
For a potential long setup, I would rather see price hold the $73,700–$74,000 support region and reclaim the EMA cluster before considering an entry. I would avoid blindly averaging down while momentum remains weak
A sustained move below $73,400 would invalidate this short-term bullish recovery idea. I would reassess the setup rather than force a trade
My Personal Perspective✅
I am cautiously watching BTC here. The market has already experienced a significant decline, so a relief recovery is possible, but that doesn't automatically mean the bottom is confirmed
I don't want to chase a green candle without confirmation. First, I want to see buyers reclaim short-term resistance with stronger volume
what do you think? Can Bitcoin recover toward $79K from this consolidation, or are we likely to see another retest of $73K first?
market is volatile, so you have to manage your own risk....👍
#CPITestsDecemberRateOutlook #BitcoinFiveWeeklyLosses #BitcoinSpotETFsPost$201MNetOutflowForThirdStraightDay #StrategyBuys1037BTCLastWeek
Price Action & Market Structure
looking at the chart, BTC previously pushed toward the $81,181 region before experiencing a strong sell-off. That move changed the short-term structure, with price losing several support areas and eventually dropping toward the $73,700–$73,400 region
since that decline, Bitcoin has been moving sideways and attempting to build a local base. Buyers are showing some interest around the lower range, but the recovery still looks relatively weak
immediate question is whether this consolidation is an accumulation phase before another recovery or simply a temporary pause in the broader downward move
Technical Indicators📊
EMA structure is something I am paying close attention to
EMA 7 is at $74,783.98, EMA 14 at $74,833.33, and EMA 28 at $74,904.96. All three are currently above the market price. This means BTC needs to reclaim the $74,800–$74,950 area before I become more confident about short-term bullish momentum
RSI is also showing a relatively weak position. RSI 6 is around 39.99, RSI 12 is 45.04, and RSI 24 is 45.62. Momentum is recovering slightly from weaker conditions, but buyers have not established strong control yet
MACD remains negative, with DIF at -65.59, DEA at -55.34, and a histogram reading of -10.25. This suggests bearish momentum has not completely disappeared.
volume is another thing worth watching. Current volume is approximately 727.479, below both the MA5 of 1.42K and MA10 of 1.38K. The recovery is therefore not yet supported by particularly strong trading activity
My Trading Plan🙋♀️
I am watching two important areas:
Support: $73,700–$73,400
Immediate resistance: $74,800–$74,950
A successful reclaim of the EMA cluster could open the door for a recovery toward these levels:
TP1: $75,555
TP2: $77,290
TP3: $79,235
$79,235 region is particularly interesting because it is also marked as an upper resistance area on the chart.
For a potential long setup, I would rather see price hold the $73,700–$74,000 support region and reclaim the EMA cluster before considering an entry. I would avoid blindly averaging down while momentum remains weak
A sustained move below $73,400 would invalidate this short-term bullish recovery idea. I would reassess the setup rather than force a trade
My Personal Perspective✅
I am cautiously watching BTC here. The market has already experienced a significant decline, so a relief recovery is possible, but that doesn't automatically mean the bottom is confirmed
I don't want to chase a green candle without confirmation. First, I want to see buyers reclaim short-term resistance with stronger volume
what do you think? Can Bitcoin recover toward $79K from this consolidation, or are we likely to see another retest of $73K first?
market is volatile, so you have to manage your own risk....👍
#CPITestsDecemberRateOutlook #BitcoinFiveWeeklyLosses #BitcoinSpotETFsPost$201MNetOutflowForThirdStraightDay #StrategyBuys1037BTCLastWeek
2
11
394
·
--
#NvidiaInvestigatesAfterHuang’sAffairApology
Sometimes, the biggest threat to a technology company doesn't come from a competitor. It can come from inside its own leadership circle.
In today's technology industry, trust is just as important as innovation. Companies invest billions in research, artificial intelligence, semiconductors, and global infrastructure. But behind all that progress, there is one thing that cannot be easily replaced: confidence in the people making critical decisions
recent situation surrounding NVIDIA CEO Jensen Huang raises an interesting question about leadership and corporate responsibility.
According to the information circulating, Huang sent an email to employees apologizing for personal actions that affected his wife and children. At the same time, reports have connected the situation to an investigation into a possible Chinese spying operation involving a female Chinese individual.
These are two sensitive matters, and they should not automatically be treated as the same issue.
What makes this situation particularly important is NVIDIA's position in the global technology ecosystem. Its chips play a major role in the development of artificial intelligence, data centers, and advanced computing. When a company operates at this level, internal security becomes more than an ordinary corporate concern. It can have implications for business confidence, technological competitiveness, and potentialy national security.
NVIDIA's board reportedly stated that there is currently no reason to believe company secrets or US national security were compromised. Huang is also expected to remain CEO while the investigation continues.
For me, the bigger lesson here is about institutional trust🤔
A company can have extraordinary technology, talented engineers, and a dominant market position, but leadership accountability still matters.
As AI becomes increasingly connected to national interests, how much responsibility should the leaders of major technology companies carry beyond simply delivering business results? Let's see.....👍
$NVDAB
#NvidiaInvestigatesAfterHuang’sAffairApology
Sometimes, the biggest threat to a technology company doesn't come from a competitor. It can come from inside its own leadership circle.
In today's technology industry, trust is just as important as innovation. Companies invest billions in research, artificial intelligence, semiconductors, and global infrastructure. But behind all that progress, there is one thing that cannot be easily replaced: confidence in the people making critical decisions
recent situation surrounding NVIDIA CEO Jensen Huang raises an interesting question about leadership and corporate responsibility.
According to the information circulating, Huang sent an email to employees apologizing for personal actions that affected his wife and children. At the same time, reports have connected the situation to an investigation into a possible Chinese spying operation involving a female Chinese individual.
These are two sensitive matters, and they should not automatically be treated as the same issue.
What makes this situation particularly important is NVIDIA's position in the global technology ecosystem. Its chips play a major role in the development of artificial intelligence, data centers, and advanced computing. When a company operates at this level, internal security becomes more than an ordinary corporate concern. It can have implications for business confidence, technological competitiveness, and potentialy national security.
NVIDIA's board reportedly stated that there is currently no reason to believe company secrets or US national security were compromised. Huang is also expected to remain CEO while the investigation continues.
For me, the bigger lesson here is about institutional trust🤔
A company can have extraordinary technology, talented engineers, and a dominant market position, but leadership accountability still matters.
As AI becomes increasingly connected to national interests, how much responsibility should the leaders of major technology companies carry beyond simply delivering business results? Let's see.....👍
$NVDAB
Sometimes, the biggest threat to a technology company doesn't come from a competitor. It can come from inside its own leadership circle.
In today's technology industry, trust is just as important as innovation. Companies invest billions in research, artificial intelligence, semiconductors, and global infrastructure. But behind all that progress, there is one thing that cannot be easily replaced: confidence in the people making critical decisions
recent situation surrounding NVIDIA CEO Jensen Huang raises an interesting question about leadership and corporate responsibility.
According to the information circulating, Huang sent an email to employees apologizing for personal actions that affected his wife and children. At the same time, reports have connected the situation to an investigation into a possible Chinese spying operation involving a female Chinese individual.
These are two sensitive matters, and they should not automatically be treated as the same issue.
What makes this situation particularly important is NVIDIA's position in the global technology ecosystem. Its chips play a major role in the development of artificial intelligence, data centers, and advanced computing. When a company operates at this level, internal security becomes more than an ordinary corporate concern. It can have implications for business confidence, technological competitiveness, and potentialy national security.
NVIDIA's board reportedly stated that there is currently no reason to believe company secrets or US national security were compromised. Huang is also expected to remain CEO while the investigation continues.
For me, the bigger lesson here is about institutional trust🤔
A company can have extraordinary technology, talented engineers, and a dominant market position, but leadership accountability still matters.
As AI becomes increasingly connected to national interests, how much responsibility should the leaders of major technology companies carry beyond simply delivering business results? Let's see.....👍
$NVDAB



11
503
·
--

Article
A Sharp Rejection From $73.4K, But Can Buyers Push Bitcoin Toward $79.8K ?$BTC
Bitcoin is showing some signs of recovery after a sharp downside move, but I'm not ready to call this a confirmed bullish reversal just yet.
On the 1H chart, BTC is trading around $75,415 after briefly testing the $73,400 area. Buyers stepped in folowing that sharp drop, bringing price back above the short-term EMA7 at $75,190. However, the recovery still needs confirmation because the EMA28 remains above the current price at $75,538.
Here's what I'm watching.
1H Technical Structure
immediate battle is happening around the $75.2K–$75.5K EMA cluster. This area is important because reclaiming it could give buyers some breathing room and improve the short-term recovery structure.
first resistance I'm watching is the $76,175 level, which is also the visible 24-hour high. A convincing 1H breakout and hold above this area would strengthen the bullish case.
Beyond that, the chart has a marked upside projection toward $79,825. I still see this as a potential recovery target, not something the market has confirmed yet.
On the momentum side, RSI6 is around 54.48, while RSI12 and RSI24 are near 48.78 and 46.16. This suggests some short-term buying strength, but momentum is not overwhelmingly bullish.
MACD remains negative, with DIF at -218.54 and DEA at -174.07. That tells me downside momentum has not fully disappeared.
Bullish Scenario🟢
If BTC holds above the recent $73,400 low and reclaims the $75,538 EMA28, I would start watching for a move toward $76,175.
A confirmed break above $76,175 could open the way toward the marked $79,825 target area.
But I want to see stronger volume behind that move. Current volume is approximately 1.48K, below both MA5 at 5.04K and MA10 at 4.31K. Without participation, a recovery could easily turn into another rejection.
Bearish Scenario🔴
If BTC fails to maintain the current recovery and loses the $75K area, selling pressure could return. most important visible downside reference remains $73,400. A decisive breakdown below this level would weaken the immediate bullish idea and make me reconsider the recovery setup.
I would rather wait for price to stabilize than assume every dip is a buying opportunity.
For Traders Already Holding BTC
I wouldn't ignore the resistance around $76,175. Traders already holding could consider partial profit-taking if price approaches resistance and momentum starts fading.
For anyone looking toward the larger $79.8K projection, I would want to see a proper breakout and sustained acceptance above $76,175 first.
DCA should also be approached carefully. Adding simply because price has dropped is not a complete strategy.
Risk Management:⚠️
$73,400 area is the key visible invalidation reference for this short-term recovery idea. A bounce without confirmation is not a reliable entry, and liquidity zones should never automatically be treated as buy zones.
Entry, stop-loss, and risk-to-reward should be established before entering. Position sizing should reflect the risk involved.
My overall view: Bitcoin has shown an encouraging reaction from the lows, but the chart still needs stronger momentum and volume. I'm not interested in chasing a recovery before buyers prove they can reclaim resistance.
Protecting capital matters more than being right about the next candle.
What's your approach here? Would you look for a confirmed breakout above $76.1K, or wait for another retest before considering a long?
The market is volatile, so you have to manage your own risk...👍
#JobsReportRaisesHikeOdds #CPITestsDecemberRateOutlook #BitcoinFiveWeeklyLosses #BinanceReopensWithdrawalsForHYPE&APT $BTC
A Sharp Rejection From $73.4K, But Can Buyers Push Bitcoin Toward $79.8K ?
$BTC
Bitcoin is showing some signs of recovery after a sharp downside move, but I'm not ready to call this a confirmed bullish reversal just yet.
On the 1H chart, BTC is trading around $75,415 after briefly testing the $73,400 area. Buyers stepped in folowing that sharp drop, bringing price back above the short-term EMA7 at $75,190. However, the recovery still needs confirmation because the EMA28 remains above the current price at $75,538.
Here's what I'm watching.
1H Technical Structure
immediate battle is happening around the $75.2K–$75.5K EMA cluster. This area is important because reclaiming it could give buyers some breathing room and improve the short-term recovery structure.
first resistance I'm watching is the $76,175 level, which is also the visible 24-hour high. A convincing 1H breakout and hold above this area would strengthen the bullish case.
Beyond that, the chart has a marked upside projection toward $79,825. I still see this as a potential recovery target, not something the market has confirmed yet.
On the momentum side, RSI6 is around 54.48, while RSI12 and RSI24 are near 48.78 and 46.16. This suggests some short-term buying strength, but momentum is not overwhelmingly bullish.
MACD remains negative, with DIF at -218.54 and DEA at -174.07. That tells me downside momentum has not fully disappeared.
Bullish Scenario🟢
If BTC holds above the recent $73,400 low and reclaims the $75,538 EMA28, I would start watching for a move toward $76,175.
A confirmed break above $76,175 could open the way toward the marked $79,825 target area.
But I want to see stronger volume behind that move. Current volume is approximately 1.48K, below both MA5 at 5.04K and MA10 at 4.31K. Without participation, a recovery could easily turn into another rejection.
Bearish Scenario🔴
If BTC fails to maintain the current recovery and loses the $75K area, selling pressure could return. most important visible downside reference remains $73,400. A decisive breakdown below this level would weaken the immediate bullish idea and make me reconsider the recovery setup.
I would rather wait for price to stabilize than assume every dip is a buying opportunity.
For Traders Already Holding BTC
I wouldn't ignore the resistance around $76,175. Traders already holding could consider partial profit-taking if price approaches resistance and momentum starts fading.
For anyone looking toward the larger $79.8K projection, I would want to see a proper breakout and sustained acceptance above $76,175 first.
DCA should also be approached carefully. Adding simply because price has dropped is not a complete strategy.
Risk Management:⚠️
$73,400 area is the key visible invalidation reference for this short-term recovery idea. A bounce without confirmation is not a reliable entry, and liquidity zones should never automatically be treated as buy zones.
Entry, stop-loss, and risk-to-reward should be established before entering. Position sizing should reflect the risk involved.
My overall view: Bitcoin has shown an encouraging reaction from the lows, but the chart still needs stronger momentum and volume. I'm not interested in chasing a recovery before buyers prove they can reclaim resistance.
Protecting capital matters more than being right about the next candle.
What's your approach here? Would you look for a confirmed breakout above $76.1K, or wait for another retest before considering a long?
The market is volatile, so you have to manage your own risk...👍
#JobsReportRaisesHikeOdds #CPITestsDecemberRateOutlook #BitcoinFiveWeeklyLosses #BinanceReopensWithdrawalsForHYPE&APT $BTC
Bitcoin is showing some signs of recovery after a sharp downside move, but I'm not ready to call this a confirmed bullish reversal just yet.
On the 1H chart, BTC is trading around $75,415 after briefly testing the $73,400 area. Buyers stepped in folowing that sharp drop, bringing price back above the short-term EMA7 at $75,190. However, the recovery still needs confirmation because the EMA28 remains above the current price at $75,538.
Here's what I'm watching.
1H Technical Structure
immediate battle is happening around the $75.2K–$75.5K EMA cluster. This area is important because reclaiming it could give buyers some breathing room and improve the short-term recovery structure.
first resistance I'm watching is the $76,175 level, which is also the visible 24-hour high. A convincing 1H breakout and hold above this area would strengthen the bullish case.
Beyond that, the chart has a marked upside projection toward $79,825. I still see this as a potential recovery target, not something the market has confirmed yet.
On the momentum side, RSI6 is around 54.48, while RSI12 and RSI24 are near 48.78 and 46.16. This suggests some short-term buying strength, but momentum is not overwhelmingly bullish.
MACD remains negative, with DIF at -218.54 and DEA at -174.07. That tells me downside momentum has not fully disappeared.
Bullish Scenario🟢
If BTC holds above the recent $73,400 low and reclaims the $75,538 EMA28, I would start watching for a move toward $76,175.
A confirmed break above $76,175 could open the way toward the marked $79,825 target area.
But I want to see stronger volume behind that move. Current volume is approximately 1.48K, below both MA5 at 5.04K and MA10 at 4.31K. Without participation, a recovery could easily turn into another rejection.
Bearish Scenario🔴
If BTC fails to maintain the current recovery and loses the $75K area, selling pressure could return. most important visible downside reference remains $73,400. A decisive breakdown below this level would weaken the immediate bullish idea and make me reconsider the recovery setup.
I would rather wait for price to stabilize than assume every dip is a buying opportunity.
For Traders Already Holding BTC
I wouldn't ignore the resistance around $76,175. Traders already holding could consider partial profit-taking if price approaches resistance and momentum starts fading.
For anyone looking toward the larger $79.8K projection, I would want to see a proper breakout and sustained acceptance above $76,175 first.
DCA should also be approached carefully. Adding simply because price has dropped is not a complete strategy.
Risk Management:⚠️
$73,400 area is the key visible invalidation reference for this short-term recovery idea. A bounce without confirmation is not a reliable entry, and liquidity zones should never automatically be treated as buy zones.
Entry, stop-loss, and risk-to-reward should be established before entering. Position sizing should reflect the risk involved.
My overall view: Bitcoin has shown an encouraging reaction from the lows, but the chart still needs stronger momentum and volume. I'm not interested in chasing a recovery before buyers prove they can reclaim resistance.
Protecting capital matters more than being right about the next candle.
What's your approach here? Would you look for a confirmed breakout above $76.1K, or wait for another retest before considering a long?
The market is volatile, so you have to manage your own risk...👍
#JobsReportRaisesHikeOdds #CPITestsDecemberRateOutlook #BitcoinFiveWeeklyLosses #BinanceReopensWithdrawalsForHYPE&APT $BTC
11
346
·
--
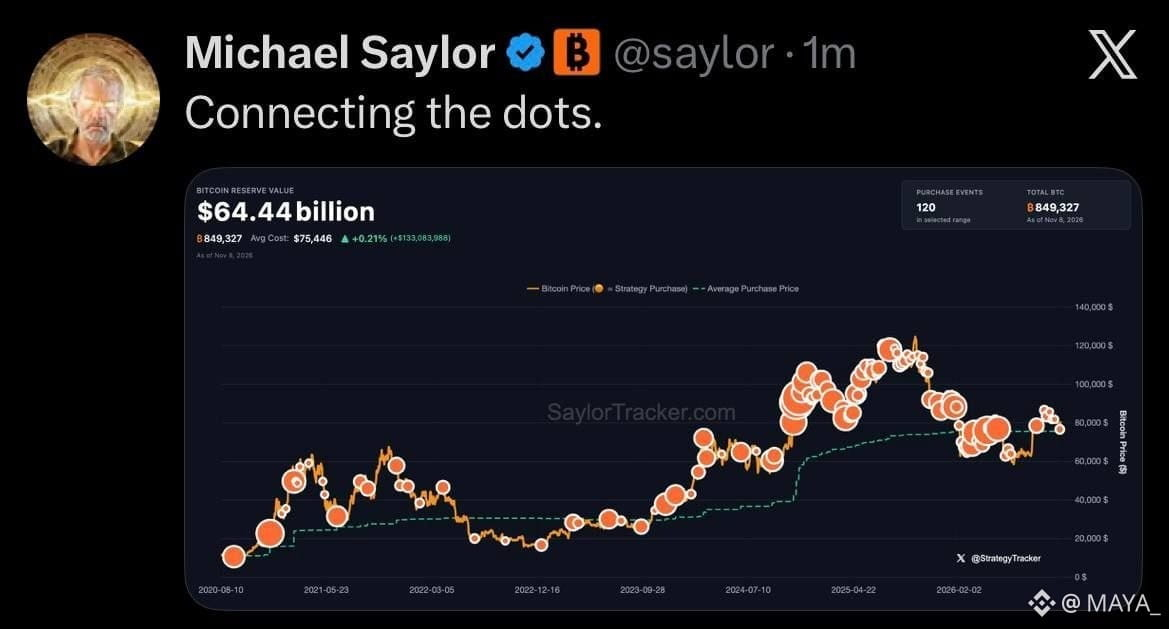
Michael Saylor seems to be hinting at another Bitcoin purchase. If you’ve been following his moves, you probably know what that means. He rarely gives these hints without a reason. Now, connecting the dots, another $BTC buy could be around the corner.
{future}(BTCUSDT)
Michael Saylor seems to be hinting at another Bitcoin purchase. If you’ve been following his moves, you probably know what that means. He rarely gives these hints without a reason. Now, connecting the dots, another $BTC buy could be around the corner.
6
154
·
--

Article
ARBUSDT LONG SETUP 🟢I mean.....
$ARB is showing early signs of a potential recovery after an extended downward move, but I don't think the bullish reversal is confirmed just yet. Price is curently trading around $0.16781, up 0.53%, and buyers are attempting to stabilize the market after the recent selloff
What makes this area interesting is the combination of short-term oversold conditions and price approaching an important decision zone. However, the broader 1H structure is still recovering from a bearish trend, so I want to see confirmation before becoming too aggressive
HERE IS WHAT THE CHART IS SHOWING📊
ARB is trading below all three visible EMAs:
EMA 7: $0.16884
EMA 14: $0.16888
EMA 28: $0.16838
This tells me that short-term momentum is not fully bullish yet. The $0.16838–$0.16888 region is the first resistance cluster that buyers need to reclaim
MACD is also showing mixed momentum. DIF is at 0.00045 while DEA is at 0.00067, with the histogram around -0.00022. Selling momentum may be losing strength, but a confirmed bullish crossover is still needed
RSI readings are:
RSI 6: 31.36
RSI 12: 44.52
RSI 24: 50.67
short-term RSI is approaching oversold territory. This could support a relief bounce, although oversold conditions alone are not a reversal signal
Volume is currently 1.20M, below MA5 at 2.58M and MA10 at 2.72M. I would like to see stronger participation behind any upward move
KEY LEVELS TO WATCH🎯
Support:🟢
$0.16584 : Immediate support and visible 24H low.
The recent lower-wick area — Important for monitoring whether buyers continue defending the recovery.
Resistance:🔴
$0.16838–$0.16888 : EMA resistance cluster.
$0.17611 : First major upside objective.
$0.19066 : Next resistance.
$0.20345 : Major overhead resistance and previous chart swing high.
MY LONG SCENARIO🚀
My preferred approach is to watch for a successful defense of $0.16584 followed by a 1H candle close above $0.16888
If buyers reclaim the EMA cluster with increasing volume, I will be looking toward:
TP1: $0.17611
TP2: $0.19066
TP3: $0.20345
If price fails to hold $0.16584, I would avoid forcing a long entry and wait for a clearer support reaction
MY TRADING PERSPECTIVE✅
I am cautiously interested in ARB for a potential long, but I don't want to confuse a short-term bounce with a confirmed trend reversal
descending trendline is still an important obstacle. A sustained breakout above it, followed by a reclaim of $0.17611, would make the bullish structure considerably more convincing
I would prefer a confirmed breakout and retest rather than chasing the current price. An exact stop-loss and DCA level cannot be established reliably from this screenshot, so I won't manufacture those numbers
market is volatile, so you have to manage your own risk.
Potential LONG setup, confirmation required.....👍
#JobsReportRaisesHikeOdds #TradFiForBeginners #CPITestsDecemberRateOutlook #WillAnthropicListOnTime
ARBUSDT LONG SETUP 🟢
I mean.....
$ARB is showing early signs of a potential recovery after an extended downward move, but I don't think the bullish reversal is confirmed just yet. Price is curently trading around $0.16781, up 0.53%, and buyers are attempting to stabilize the market after the recent selloff
What makes this area interesting is the combination of short-term oversold conditions and price approaching an important decision zone. However, the broader 1H structure is still recovering from a bearish trend, so I want to see confirmation before becoming too aggressive
HERE IS WHAT THE CHART IS SHOWING📊
ARB is trading below all three visible EMAs:
EMA 7: $0.16884
EMA 14: $0.16888
EMA 28: $0.16838
This tells me that short-term momentum is not fully bullish yet. The $0.16838–$0.16888 region is the first resistance cluster that buyers need to reclaim
MACD is also showing mixed momentum. DIF is at 0.00045 while DEA is at 0.00067, with the histogram around -0.00022. Selling momentum may be losing strength, but a confirmed bullish crossover is still needed
RSI readings are:
RSI 6: 31.36
RSI 12: 44.52
RSI 24: 50.67
short-term RSI is approaching oversold territory. This could support a relief bounce, although oversold conditions alone are not a reversal signal
Volume is currently 1.20M, below MA5 at 2.58M and MA10 at 2.72M. I would like to see stronger participation behind any upward move
KEY LEVELS TO WATCH🎯
Support:🟢
$0.16584 : Immediate support and visible 24H low.
The recent lower-wick area — Important for monitoring whether buyers continue defending the recovery.
Resistance:🔴
$0.16838–$0.16888 : EMA resistance cluster.
$0.17611 : First major upside objective.
$0.19066 : Next resistance.
$0.20345 : Major overhead resistance and previous chart swing high.
MY LONG SCENARIO🚀
My preferred approach is to watch for a successful defense of $0.16584 followed by a 1H candle close above $0.16888
If buyers reclaim the EMA cluster with increasing volume, I will be looking toward:
TP1: $0.17611
TP2: $0.19066
TP3: $0.20345
If price fails to hold $0.16584, I would avoid forcing a long entry and wait for a clearer support reaction
MY TRADING PERSPECTIVE✅
I am cautiously interested in ARB for a potential long, but I don't want to confuse a short-term bounce with a confirmed trend reversal
descending trendline is still an important obstacle. A sustained breakout above it, followed by a reclaim of $0.17611, would make the bullish structure considerably more convincing
I would prefer a confirmed breakout and retest rather than chasing the current price. An exact stop-loss and DCA level cannot be established reliably from this screenshot, so I won't manufacture those numbers
market is volatile, so you have to manage your own risk.
Potential LONG setup, confirmation required.....👍
#JobsReportRaisesHikeOdds #TradFiForBeginners #CPITestsDecemberRateOutlook #WillAnthropicListOnTime
$ARB is showing early signs of a potential recovery after an extended downward move, but I don't think the bullish reversal is confirmed just yet. Price is curently trading around $0.16781, up 0.53%, and buyers are attempting to stabilize the market after the recent selloff
What makes this area interesting is the combination of short-term oversold conditions and price approaching an important decision zone. However, the broader 1H structure is still recovering from a bearish trend, so I want to see confirmation before becoming too aggressive
HERE IS WHAT THE CHART IS SHOWING📊
ARB is trading below all three visible EMAs:
EMA 7: $0.16884
EMA 14: $0.16888
EMA 28: $0.16838
This tells me that short-term momentum is not fully bullish yet. The $0.16838–$0.16888 region is the first resistance cluster that buyers need to reclaim
MACD is also showing mixed momentum. DIF is at 0.00045 while DEA is at 0.00067, with the histogram around -0.00022. Selling momentum may be losing strength, but a confirmed bullish crossover is still needed
RSI readings are:
RSI 6: 31.36
RSI 12: 44.52
RSI 24: 50.67
short-term RSI is approaching oversold territory. This could support a relief bounce, although oversold conditions alone are not a reversal signal
Volume is currently 1.20M, below MA5 at 2.58M and MA10 at 2.72M. I would like to see stronger participation behind any upward move
KEY LEVELS TO WATCH🎯
Support:🟢
$0.16584 : Immediate support and visible 24H low.
The recent lower-wick area — Important for monitoring whether buyers continue defending the recovery.
Resistance:🔴
$0.16838–$0.16888 : EMA resistance cluster.
$0.17611 : First major upside objective.
$0.19066 : Next resistance.
$0.20345 : Major overhead resistance and previous chart swing high.
MY LONG SCENARIO🚀
My preferred approach is to watch for a successful defense of $0.16584 followed by a 1H candle close above $0.16888
If buyers reclaim the EMA cluster with increasing volume, I will be looking toward:
TP1: $0.17611
TP2: $0.19066
TP3: $0.20345
If price fails to hold $0.16584, I would avoid forcing a long entry and wait for a clearer support reaction
MY TRADING PERSPECTIVE✅
I am cautiously interested in ARB for a potential long, but I don't want to confuse a short-term bounce with a confirmed trend reversal
descending trendline is still an important obstacle. A sustained breakout above it, followed by a reclaim of $0.17611, would make the bullish structure considerably more convincing
I would prefer a confirmed breakout and retest rather than chasing the current price. An exact stop-loss and DCA level cannot be established reliably from this screenshot, so I won't manufacture those numbers
market is volatile, so you have to manage your own risk.
Potential LONG setup, confirmation required.....👍
#JobsReportRaisesHikeOdds #TradFiForBeginners #CPITestsDecemberRateOutlook #WillAnthropicListOnTime
9
105
·
--

Article
Bitcoin's Biggest Opportunities Often Appear When Everyone Else Is Losing Confidence#JobsReportRaisesHikeOdds #CPITestsDecemberRateOutlook #BitcoinETFsSee$412MNetOutflows
one thing I've noticed about the crypto market is that people often say they want to buy Bitcoin at a discount, but when the market actually gives them that opportunity, fear takes over. Everyone wants to catch the next major rally. Very few are mentally prepared for the corrections that happen along the way.
On November 6, someone reportedly bought $228 million worth of $BTC. That's an interesting observation, especially when the market is going through a dip. While some traders are becoming nervous about short-term price movements, larger market participants may be looking at the same situation from a completely different perspective.
hmm, And honestly, this is where market psychology becomes important. Bitcoin doesn't move upward in a straight line. Even during strong bullish cycles, corrections are part of the process. A market that eventually delivers a 200% or 300% move can still experience 20% or 30% pullbacks along the way. That's something many new traders struggle to accept. When Bitcoin starts climbing, excitement builds quickly. People become confident, social media fills with bullish predictions, and suddenly everyone wants exposure. But when the market corrects, that confidence can disappear almost overnight.
same people who were waiting for higher prices suddenly start expecting another major crash. This creates a familiar cycle: buying when everything looks positive and selling when uncertainty becomes uncomfortable.
Meanwhile, experienced market participants tend to pay attention to different things. They look at liquidity, market structure, broader trends, and whether a correction changes the bigger picture.
A dip doesn't automatically mean the bullish trend is over. At the same time, a large purchase doesn't guarantee that Bitcoin is about to recover
That's an important distinction.
The reported $228 million purchase on November 6 is worth watching, but I wouldn't treat one transaction as proof of future price direction. Large buyers can have different strategies, time horizons, and reasons for entering the market
What matters more is how the market behaves after these purchases.
Does buying pressure continue? Does Bitcoin recover important levels? Are other participants gradually returning, or is the market still struggling with selling pressure?
These are the questions I'd rather focus on instead of reacting emotionally to every candle.
I also think there's a bigger lesson here about how people approach investing.
You don't need to catch the exact bottom to make a reasonable decision. Trying to buy at the lowest possible price often creates unnecessary pressure. Understanding your risk, having a plan, and accepting that volatility is part of the market can be much more useful. Bitcoin's long-term growth story has never meant that every entry point will be comfortable. Some of the strongest market opportunities can appear during periods when confidence is weak. But recognizing an opportunity and managing the risk around it are two very different things.
So, instead of asking whether every correction signals the end of the rally, perhaps we should ask something more important:
When Bitcoin experiences another 20%–30% correction on its way toward a much larger move, will you have the patience and discipline to follow your plan, or will market fear make the decision for you?
$BTC
{future}(BTCUSDT)
Bitcoin's Biggest Opportunities Often Appear When Everyone Else Is Losing Confidence
#JobsReportRaisesHikeOdds #CPITestsDecemberRateOutlook #BitcoinETFsSee$412MNetOutflows
one thing I've noticed about the crypto market is that people often say they want to buy Bitcoin at a discount, but when the market actually gives them that opportunity, fear takes over. Everyone wants to catch the next major rally. Very few are mentally prepared for the corrections that happen along the way.
On November 6, someone reportedly bought $228 million worth of $BTC . That's an interesting observation, especially when the market is going through a dip. While some traders are becoming nervous about short-term price movements, larger market participants may be looking at the same situation from a completely different perspective.
hmm, And honestly, this is where market psychology becomes important. Bitcoin doesn't move upward in a straight line. Even during strong bullish cycles, corrections are part of the process. A market that eventually delivers a 200% or 300% move can still experience 20% or 30% pullbacks along the way. That's something many new traders struggle to accept. When Bitcoin starts climbing, excitement builds quickly. People become confident, social media fills with bullish predictions, and suddenly everyone wants exposure. But when the market corrects, that confidence can disappear almost overnight.
same people who were waiting for higher prices suddenly start expecting another major crash. This creates a familiar cycle: buying when everything looks positive and selling when uncertainty becomes uncomfortable.
Meanwhile, experienced market participants tend to pay attention to different things. They look at liquidity, market structure, broader trends, and whether a correction changes the bigger picture.
A dip doesn't automatically mean the bullish trend is over. At the same time, a large purchase doesn't guarantee that Bitcoin is about to recover
That's an important distinction.
The reported $228 million purchase on November 6 is worth watching, but I wouldn't treat one transaction as proof of future price direction. Large buyers can have different strategies, time horizons, and reasons for entering the market
What matters more is how the market behaves after these purchases.
Does buying pressure continue? Does Bitcoin recover important levels? Are other participants gradually returning, or is the market still struggling with selling pressure?
These are the questions I'd rather focus on instead of reacting emotionally to every candle.
I also think there's a bigger lesson here about how people approach investing.
You don't need to catch the exact bottom to make a reasonable decision. Trying to buy at the lowest possible price often creates unnecessary pressure. Understanding your risk, having a plan, and accepting that volatility is part of the market can be much more useful. Bitcoin's long-term growth story has never meant that every entry point will be comfortable. Some of the strongest market opportunities can appear during periods when confidence is weak. But recognizing an opportunity and managing the risk around it are two very different things.
So, instead of asking whether every correction signals the end of the rally, perhaps we should ask something more important:
When Bitcoin experiences another 20%–30% correction on its way toward a much larger move, will you have the patience and discipline to follow your plan, or will market fear make the decision for you?
$BTC
one thing I've noticed about the crypto market is that people often say they want to buy Bitcoin at a discount, but when the market actually gives them that opportunity, fear takes over. Everyone wants to catch the next major rally. Very few are mentally prepared for the corrections that happen along the way.
On November 6, someone reportedly bought $228 million worth of $BTC . That's an interesting observation, especially when the market is going through a dip. While some traders are becoming nervous about short-term price movements, larger market participants may be looking at the same situation from a completely different perspective.
hmm, And honestly, this is where market psychology becomes important. Bitcoin doesn't move upward in a straight line. Even during strong bullish cycles, corrections are part of the process. A market that eventually delivers a 200% or 300% move can still experience 20% or 30% pullbacks along the way. That's something many new traders struggle to accept. When Bitcoin starts climbing, excitement builds quickly. People become confident, social media fills with bullish predictions, and suddenly everyone wants exposure. But when the market corrects, that confidence can disappear almost overnight.
same people who were waiting for higher prices suddenly start expecting another major crash. This creates a familiar cycle: buying when everything looks positive and selling when uncertainty becomes uncomfortable.
Meanwhile, experienced market participants tend to pay attention to different things. They look at liquidity, market structure, broader trends, and whether a correction changes the bigger picture.
A dip doesn't automatically mean the bullish trend is over. At the same time, a large purchase doesn't guarantee that Bitcoin is about to recover
That's an important distinction.
The reported $228 million purchase on November 6 is worth watching, but I wouldn't treat one transaction as proof of future price direction. Large buyers can have different strategies, time horizons, and reasons for entering the market
What matters more is how the market behaves after these purchases.
Does buying pressure continue? Does Bitcoin recover important levels? Are other participants gradually returning, or is the market still struggling with selling pressure?
These are the questions I'd rather focus on instead of reacting emotionally to every candle.
I also think there's a bigger lesson here about how people approach investing.
You don't need to catch the exact bottom to make a reasonable decision. Trying to buy at the lowest possible price often creates unnecessary pressure. Understanding your risk, having a plan, and accepting that volatility is part of the market can be much more useful. Bitcoin's long-term growth story has never meant that every entry point will be comfortable. Some of the strongest market opportunities can appear during periods when confidence is weak. But recognizing an opportunity and managing the risk around it are two very different things.
So, instead of asking whether every correction signals the end of the rally, perhaps we should ask something more important:
When Bitcoin experiences another 20%–30% correction on its way toward a much larger move, will you have the patience and discipline to follow your plan, or will market fear make the decision for you?
$BTC
10
509
·
--
Verified
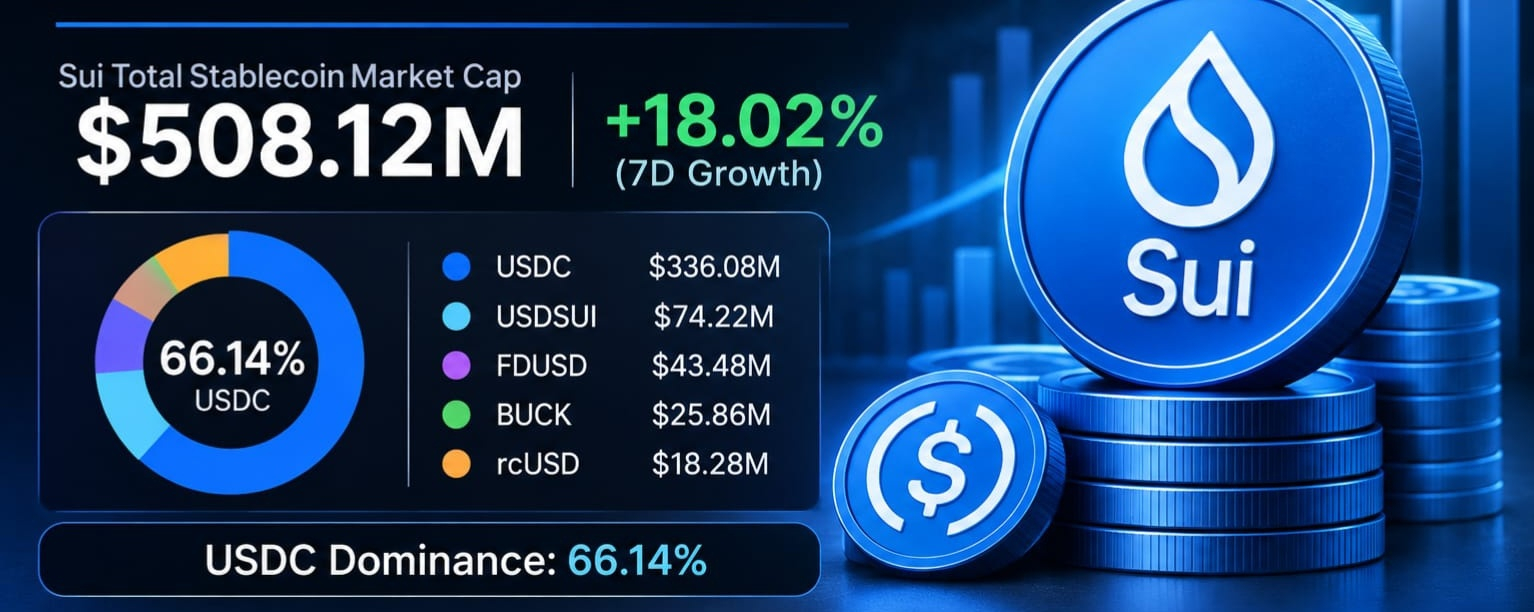
Article
Stablecoin Liquidity Is Quietly Changing the Conversation Around Sui$SUI
One of the bigest challenges for any blockchain isn't necessarily attracting attention. It's giving people a reason to keep money inside its ecosystem and actually use it.
a network can have impressive technology, active communities, and plenty of development activity. But without accessible liquidity, many of those opportunities remain limited. Users need capital to move, applications need money flowing through them, and businesses need reliable assets to operate. This is where stablecoins become more important than many people realize. Unlike volatile cryptocurrencies, stablecoins are designed to maintain a relatively stable value. They give users a way to hold value, transfer funds, and interact with blockchain applications without constantly worrying about market fluctuations. In simple terms, they provide a financial foundation that other activities can build on.
And as Web3 continues to mature, the availability of stablecoin liquidity could become one of the more meaningful ways to understand whether a blockchain ecosystem is developing real economic activity.
But there is another side to this conversation.
Growing liquidity is important, yet where that liquidity comes from matters just as much.
A network with a larger stablecoin supply has more capital available within its ecosystem. However, if most of that supply depends on a single stablecoin, concentration becomes something worth watching. Growth and diversification are two different things, and I think both deserve attention.
brings me to something interesting happening on Sui Network.
According to the information shared from DefiLlama, Sui's total stablecoin market capitalization reached approximately $508.12 million as of November 5, 2026. That's an increase of 18.02% over seven days, while another figure in the report describes weekly growth of around 18.1%.
Crossing the $500 million threshold is worth paying attention to, especially considering how quickly that supply has expanded over a relatively short period.
What makes the numbers more interesting is the composition of that liquidity.
Circle's USDC represents the largest share, with approximately $336.08 million on the network. Its dominance stood at 66.14%, meaning roughly two-thirds of Sui's stablecoin supply was concentrated in one asset.
remaining liquidity comes from several other stablecoins.
Sui Dollar (USDSUI) accounts for $74.22 million, First Digital USD (FDUSD) holds $43.48 million, Bucket Protocol's BUCK represents $25.86 million, and R25's rcUSD contributes $18.28 million.
USDC also recorded a 7.40% increase over the previous day, according to the same data.
Personally, I find the distribution just as interesting as the headline number
USDC's leading position suggests that a substantial portion of the stablecoin liquidity available on Sui is connected to an established dollar-backed asset. That can be useful for users and applications that need a familiar unit of value when interacting with decentralized finance.
At the same time, the presence of several other stablecoins shows that the network's stablecoin environment isn't limited to a single asset.
Still, I wouldn't confuse a growing stablecoin supply with guaranteed ecosystem adoption💥
That's where the next stage of development becomes interesting.
If stablecoin supply continues growing and more applications find ways to put that capital to productive use, Sui could develop a deeper financial environment where users have more reasons to remain active within the ecosystem.
But I would also keep an eye on stablecoin concentration. A healthy financial ecosystem needs liquidity, accessibility, and a diverse range of options. Those elements should develop together rather than being judged by one impressive number.
The broader Web3 industry is gradually moving toward a stage where infrastructure alone may not be enough to distinguish one network from another. Actual financial activity, available liquidity, and the ability to support everyday economic interactions could become much more important.
For me, the interesting part isn't simply that Sui has crossed $500 million in stablecoin supply.
It's what happens next.
Will this growing pool of capital translate into deper on-chain activity, stronger DeFi participation, and more practical financial use cases? Or will stablecoin supply grow faster than the actual demand to use it?
Because ultimately, a blockchain's financial strength shouldn't only be measured by how much money enters its ecosystem. It should also be measured by what people can actually do with that money once it gets there.
And that's the question I think is worth watching as Sui continues to develop...🤔
#JobsReportRaisesHikeOdds #CPITestsDecemberRateOutlook #BitcoinRebounds$75KAsChipsLead #WillAnthropicListOnTime #TradFiForBeginners
Stablecoin Liquidity Is Quietly Changing the Conversation Around Sui
$SUI
One of the bigest challenges for any blockchain isn't necessarily attracting attention. It's giving people a reason to keep money inside its ecosystem and actually use it.
a network can have impressive technology, active communities, and plenty of development activity. But without accessible liquidity, many of those opportunities remain limited. Users need capital to move, applications need money flowing through them, and businesses need reliable assets to operate. This is where stablecoins become more important than many people realize. Unlike volatile cryptocurrencies, stablecoins are designed to maintain a relatively stable value. They give users a way to hold value, transfer funds, and interact with blockchain applications without constantly worrying about market fluctuations. In simple terms, they provide a financial foundation that other activities can build on.
And as Web3 continues to mature, the availability of stablecoin liquidity could become one of the more meaningful ways to understand whether a blockchain ecosystem is developing real economic activity.
But there is another side to this conversation.
Growing liquidity is important, yet where that liquidity comes from matters just as much.
A network with a larger stablecoin supply has more capital available within its ecosystem. However, if most of that supply depends on a single stablecoin, concentration becomes something worth watching. Growth and diversification are two different things, and I think both deserve attention.
brings me to something interesting happening on Sui Network.
According to the information shared from DefiLlama, Sui's total stablecoin market capitalization reached approximately $508.12 million as of November 5, 2026. That's an increase of 18.02% over seven days, while another figure in the report describes weekly growth of around 18.1%.
Crossing the $500 million threshold is worth paying attention to, especially considering how quickly that supply has expanded over a relatively short period.
What makes the numbers more interesting is the composition of that liquidity.
Circle's USDC represents the largest share, with approximately $336.08 million on the network. Its dominance stood at 66.14%, meaning roughly two-thirds of Sui's stablecoin supply was concentrated in one asset.
remaining liquidity comes from several other stablecoins.
Sui Dollar (USDSUI) accounts for $74.22 million, First Digital USD (FDUSD) holds $43.48 million, Bucket Protocol's BUCK represents $25.86 million, and R25's rcUSD contributes $18.28 million.
USDC also recorded a 7.40% increase over the previous day, according to the same data.
Personally, I find the distribution just as interesting as the headline number
USDC's leading position suggests that a substantial portion of the stablecoin liquidity available on Sui is connected to an established dollar-backed asset. That can be useful for users and applications that need a familiar unit of value when interacting with decentralized finance.
At the same time, the presence of several other stablecoins shows that the network's stablecoin environment isn't limited to a single asset.
Still, I wouldn't confuse a growing stablecoin supply with guaranteed ecosystem adoption💥
That's where the next stage of development becomes interesting.
If stablecoin supply continues growing and more applications find ways to put that capital to productive use, Sui could develop a deeper financial environment where users have more reasons to remain active within the ecosystem.
But I would also keep an eye on stablecoin concentration. A healthy financial ecosystem needs liquidity, accessibility, and a diverse range of options. Those elements should develop together rather than being judged by one impressive number.
The broader Web3 industry is gradually moving toward a stage where infrastructure alone may not be enough to distinguish one network from another. Actual financial activity, available liquidity, and the ability to support everyday economic interactions could become much more important.
For me, the interesting part isn't simply that Sui has crossed $500 million in stablecoin supply.
It's what happens next.
Will this growing pool of capital translate into deper on-chain activity, stronger DeFi participation, and more practical financial use cases? Or will stablecoin supply grow faster than the actual demand to use it?
Because ultimately, a blockchain's financial strength shouldn't only be measured by how much money enters its ecosystem. It should also be measured by what people can actually do with that money once it gets there.
And that's the question I think is worth watching as Sui continues to develop...🤔
#JobsReportRaisesHikeOdds #CPITestsDecemberRateOutlook #BitcoinRebounds$75KAsChipsLead #WillAnthropicListOnTime #TradFiForBeginners
One of the bigest challenges for any blockchain isn't necessarily attracting attention. It's giving people a reason to keep money inside its ecosystem and actually use it.
a network can have impressive technology, active communities, and plenty of development activity. But without accessible liquidity, many of those opportunities remain limited. Users need capital to move, applications need money flowing through them, and businesses need reliable assets to operate. This is where stablecoins become more important than many people realize. Unlike volatile cryptocurrencies, stablecoins are designed to maintain a relatively stable value. They give users a way to hold value, transfer funds, and interact with blockchain applications without constantly worrying about market fluctuations. In simple terms, they provide a financial foundation that other activities can build on.
And as Web3 continues to mature, the availability of stablecoin liquidity could become one of the more meaningful ways to understand whether a blockchain ecosystem is developing real economic activity.
But there is another side to this conversation.
Growing liquidity is important, yet where that liquidity comes from matters just as much.
A network with a larger stablecoin supply has more capital available within its ecosystem. However, if most of that supply depends on a single stablecoin, concentration becomes something worth watching. Growth and diversification are two different things, and I think both deserve attention.
brings me to something interesting happening on Sui Network.
According to the information shared from DefiLlama, Sui's total stablecoin market capitalization reached approximately $508.12 million as of November 5, 2026. That's an increase of 18.02% over seven days, while another figure in the report describes weekly growth of around 18.1%.
Crossing the $500 million threshold is worth paying attention to, especially considering how quickly that supply has expanded over a relatively short period.
What makes the numbers more interesting is the composition of that liquidity.
Circle's USDC represents the largest share, with approximately $336.08 million on the network. Its dominance stood at 66.14%, meaning roughly two-thirds of Sui's stablecoin supply was concentrated in one asset.
remaining liquidity comes from several other stablecoins.
Sui Dollar (USDSUI) accounts for $74.22 million, First Digital USD (FDUSD) holds $43.48 million, Bucket Protocol's BUCK represents $25.86 million, and R25's rcUSD contributes $18.28 million.
USDC also recorded a 7.40% increase over the previous day, according to the same data.
Personally, I find the distribution just as interesting as the headline number
USDC's leading position suggests that a substantial portion of the stablecoin liquidity available on Sui is connected to an established dollar-backed asset. That can be useful for users and applications that need a familiar unit of value when interacting with decentralized finance.
At the same time, the presence of several other stablecoins shows that the network's stablecoin environment isn't limited to a single asset.
Still, I wouldn't confuse a growing stablecoin supply with guaranteed ecosystem adoption💥
That's where the next stage of development becomes interesting.
If stablecoin supply continues growing and more applications find ways to put that capital to productive use, Sui could develop a deeper financial environment where users have more reasons to remain active within the ecosystem.
But I would also keep an eye on stablecoin concentration. A healthy financial ecosystem needs liquidity, accessibility, and a diverse range of options. Those elements should develop together rather than being judged by one impressive number.
The broader Web3 industry is gradually moving toward a stage where infrastructure alone may not be enough to distinguish one network from another. Actual financial activity, available liquidity, and the ability to support everyday economic interactions could become much more important.
For me, the interesting part isn't simply that Sui has crossed $500 million in stablecoin supply.
It's what happens next.
Will this growing pool of capital translate into deper on-chain activity, stronger DeFi participation, and more practical financial use cases? Or will stablecoin supply grow faster than the actual demand to use it?
Because ultimately, a blockchain's financial strength shouldn't only be measured by how much money enters its ecosystem. It should also be measured by what people can actually do with that money once it gets there.
And that's the question I think is worth watching as Sui continues to develop...🤔
#JobsReportRaisesHikeOdds #CPITestsDecemberRateOutlook #BitcoinRebounds$75KAsChipsLead #WillAnthropicListOnTime #TradFiForBeginners
9
867
·
--
$NVDAB My next long scenario relies on a healthy pulback and structural confirmation, not chasing momentum off a local bounce.
{spot}(NVDABUSDT)
NVDA has stabilized around $188.70 after a sharp drop from its recent high near $204.26 down to a low near $179.70. While we saw a strong relief push up toward the $198.29 region, buying directly into this bounce carries risk as overhead supply and technical resistance levels linger. MACD shows momentum flattening out while RSI sits neutrally around 55, suggesting the market is taking a breath rather than launching straight into an immediate trend continuation💥
area between $184.84 and $185.67 represents the demand zone where my plan becomes interesting. This zone aligns closely with key retracement structure from the initial reversal leg. I am watching for price to pull back into this $185 region, potentially sweeping liquidity near the local lows before confirming a higher low with strong buyer absorption. If buyers defend this level, upside targets sit at the $193.15 to $195.72 Fibonacci zone (0.5 to 1.0 expansion levels), with secondary targets extending toward $198.29 and $199.02
This is a conditional setup requiring confirmation, not an immediate entry. A sustained breakdown below the $184.84 demand level invalidates the setup and suggests price could retest the macro support near $179.70. Any position taken requires a protective stop below the confirmed structural low with strict risk-to-reward management. The real test now is whether NVDA can build a stable higher low above $185 without surrendering its initial recovery gains...🤔
$NVDAB My next long scenario relies on a healthy pulback and structural confirmation, not chasing momentum off a local bounce.
NVDA has stabilized around $188.70 after a sharp drop from its recent high near $204.26 down to a low near $179.70. While we saw a strong relief push up toward the $198.29 region, buying directly into this bounce carries risk as overhead supply and technical resistance levels linger. MACD shows momentum flattening out while RSI sits neutrally around 55, suggesting the market is taking a breath rather than launching straight into an immediate trend continuation💥
area between $184.84 and $185.67 represents the demand zone where my plan becomes interesting. This zone aligns closely with key retracement structure from the initial reversal leg. I am watching for price to pull back into this $185 region, potentially sweeping liquidity near the local lows before confirming a higher low with strong buyer absorption. If buyers defend this level, upside targets sit at the $193.15 to $195.72 Fibonacci zone (0.5 to 1.0 expansion levels), with secondary targets extending toward $198.29 and $199.02
This is a conditional setup requiring confirmation, not an immediate entry. A sustained breakdown below the $184.84 demand level invalidates the setup and suggests price could retest the macro support near $179.70. Any position taken requires a protective stop below the confirmed structural low with strict risk-to-reward management. The real test now is whether NVDA can build a stable higher low above $185 without surrendering its initial recovery gains...🤔
NVDA has stabilized around $188.70 after a sharp drop from its recent high near $204.26 down to a low near $179.70. While we saw a strong relief push up toward the $198.29 region, buying directly into this bounce carries risk as overhead supply and technical resistance levels linger. MACD shows momentum flattening out while RSI sits neutrally around 55, suggesting the market is taking a breath rather than launching straight into an immediate trend continuation💥
area between $184.84 and $185.67 represents the demand zone where my plan becomes interesting. This zone aligns closely with key retracement structure from the initial reversal leg. I am watching for price to pull back into this $185 region, potentially sweeping liquidity near the local lows before confirming a higher low with strong buyer absorption. If buyers defend this level, upside targets sit at the $193.15 to $195.72 Fibonacci zone (0.5 to 1.0 expansion levels), with secondary targets extending toward $198.29 and $199.02
This is a conditional setup requiring confirmation, not an immediate entry. A sustained breakdown below the $184.84 demand level invalidates the setup and suggests price could retest the macro support near $179.70. Any position taken requires a protective stop below the confirmed structural low with strict risk-to-reward management. The real test now is whether NVDA can build a stable higher low above $185 without surrendering its initial recovery gains...🤔

10
428
·
--

Article
BNBUSDT 1H Chart Analysis : Testing Key Fib and EMA Confluence hmm, I am watching $BNB closely right now on the 1-hour timeframe as it trades around the 695.16 mark, up about +0.59% on the sesion. We are sitting in an interesting technical zone right after a notable pullback from local highs, making this a crucial area to monitor for the next directional move
Price Action & Technical Read
Looking at the recent swing structure, price faced sharp rejection from higher levels near the 734.57 swing high (marked by the 0.0 Fibonacci level) and pulled back sharply, printing a local low down toward the 687.53 region (2.618 Fib extension level). Currently, price has bounced slightly and is consolidating around 695.16
Checking the visible indicators on the chart:
EMAs: The EMA lines are tightly bunched right above current price action—EMA 7 sits at 694.63, EMA 14 at 694.52, and EMA 28 at 695.04. Price is interacting directly with these moving averages, signaling a short-term tightening
Fibonacci Retracement: The recent retracement tool shows price hovering just below the 1.0 level (716.60) and pressing down toward lower extension targets, with the 2.618 level acting as recent support around 687.53
MACD (12, 26, 9): Showing DIF at -0.37, DEA at -0.65, and a positive MACD histogram value of 0.27, hinting at a slight shift in momentum trying to stabilize after the downside pressure
RSI (6): Printing at 58.53, with RSI(12) at 52.04 and RSI(24) at 47.81, indicating a neutral-to-mildly-bullish recovery bounce on the lower timeframe without being overbought yet
volume: Volume bars remain relatively subdued following the earlier high-volume flush, showing a cooling-off period as traders wait for a clearer catalyst
Execution Strategy and Risk Management
This setup is tricky because we are squeezed right around the EMA cluster and recovering from a steep drop. I am not rushing into a blind market order here, but I am mapping out levels for potential reaction:
Entry Zone: If we see a successful retest and hold above the 694–695 EMA cluster, a scalp or short-term swing long could become interesting. Alternatively, I am watching to see if price dips back closer to the 687.53 support for a more discounted entry
DCA Levels: If the broader market dips further, scaling in closer to the 687–690 support pocket makes logical sense based on the visible extension levels
Stop Loss: A clean invalidation would be a breakdown below the recent swing low structure beneath 685, keeping risk tight👍
TP1: First realistic resistance target sits back near the 705.50 (1.618 Fib) level
TP2: Extended target up toward the 716.60 (1.0 Fib) resistance zone if bullish momentum expands
Personal Trading Perspective✅
My technical read is that BNB is trying to build a base after a sharp rejection, but it hasn't confirmed a full trend reversal yet. I want to see if the EMA cluster can hold as immediate support. If it loses this footing, I'm fully prepared to step aside and wait for a deeper retest. Markets don't owe us a trade, so patience is key here
What are your thoughts on BNB here are you looking to catch a bounce off these EMAs, or are you expecting another sweep of the lows? 🤔
#JobsReportRaisesHikeOdds
BNBUSDT 1H Chart Analysis : Testing Key Fib and EMA Confluence
hmm, I am watching $BNB closely right now on the 1-hour timeframe as it trades around the 695.16 mark, up about +0.59% on the sesion. We are sitting in an interesting technical zone right after a notable pullback from local highs, making this a crucial area to monitor for the next directional move
Price Action & Technical Read
Looking at the recent swing structure, price faced sharp rejection from higher levels near the 734.57 swing high (marked by the 0.0 Fibonacci level) and pulled back sharply, printing a local low down toward the 687.53 region (2.618 Fib extension level). Currently, price has bounced slightly and is consolidating around 695.16
Checking the visible indicators on the chart:
EMAs: The EMA lines are tightly bunched right above current price action—EMA 7 sits at 694.63, EMA 14 at 694.52, and EMA 28 at 695.04. Price is interacting directly with these moving averages, signaling a short-term tightening
Fibonacci Retracement: The recent retracement tool shows price hovering just below the 1.0 level (716.60) and pressing down toward lower extension targets, with the 2.618 level acting as recent support around 687.53
MACD (12, 26, 9): Showing DIF at -0.37, DEA at -0.65, and a positive MACD histogram value of 0.27, hinting at a slight shift in momentum trying to stabilize after the downside pressure
RSI (6): Printing at 58.53, with RSI(12) at 52.04 and RSI(24) at 47.81, indicating a neutral-to-mildly-bullish recovery bounce on the lower timeframe without being overbought yet
volume: Volume bars remain relatively subdued following the earlier high-volume flush, showing a cooling-off period as traders wait for a clearer catalyst
Execution Strategy and Risk Management
This setup is tricky because we are squeezed right around the EMA cluster and recovering from a steep drop. I am not rushing into a blind market order here, but I am mapping out levels for potential reaction:
Entry Zone: If we see a successful retest and hold above the 694–695 EMA cluster, a scalp or short-term swing long could become interesting. Alternatively, I am watching to see if price dips back closer to the 687.53 support for a more discounted entry
DCA Levels: If the broader market dips further, scaling in closer to the 687–690 support pocket makes logical sense based on the visible extension levels
Stop Loss: A clean invalidation would be a breakdown below the recent swing low structure beneath 685, keeping risk tight👍
TP1: First realistic resistance target sits back near the 705.50 (1.618 Fib) level
TP2: Extended target up toward the 716.60 (1.0 Fib) resistance zone if bullish momentum expands
Personal Trading Perspective✅
My technical read is that BNB is trying to build a base after a sharp rejection, but it hasn't confirmed a full trend reversal yet. I want to see if the EMA cluster can hold as immediate support. If it loses this footing, I'm fully prepared to step aside and wait for a deeper retest. Markets don't owe us a trade, so patience is key here
What are your thoughts on BNB here are you looking to catch a bounce off these EMAs, or are you expecting another sweep of the lows? 🤔
#JobsReportRaisesHikeOdds
Price Action & Technical Read
Looking at the recent swing structure, price faced sharp rejection from higher levels near the 734.57 swing high (marked by the 0.0 Fibonacci level) and pulled back sharply, printing a local low down toward the 687.53 region (2.618 Fib extension level). Currently, price has bounced slightly and is consolidating around 695.16
Checking the visible indicators on the chart:
EMAs: The EMA lines are tightly bunched right above current price action—EMA 7 sits at 694.63, EMA 14 at 694.52, and EMA 28 at 695.04. Price is interacting directly with these moving averages, signaling a short-term tightening
Fibonacci Retracement: The recent retracement tool shows price hovering just below the 1.0 level (716.60) and pressing down toward lower extension targets, with the 2.618 level acting as recent support around 687.53
MACD (12, 26, 9): Showing DIF at -0.37, DEA at -0.65, and a positive MACD histogram value of 0.27, hinting at a slight shift in momentum trying to stabilize after the downside pressure
RSI (6): Printing at 58.53, with RSI(12) at 52.04 and RSI(24) at 47.81, indicating a neutral-to-mildly-bullish recovery bounce on the lower timeframe without being overbought yet
volume: Volume bars remain relatively subdued following the earlier high-volume flush, showing a cooling-off period as traders wait for a clearer catalyst
Execution Strategy and Risk Management
This setup is tricky because we are squeezed right around the EMA cluster and recovering from a steep drop. I am not rushing into a blind market order here, but I am mapping out levels for potential reaction:
Entry Zone: If we see a successful retest and hold above the 694–695 EMA cluster, a scalp or short-term swing long could become interesting. Alternatively, I am watching to see if price dips back closer to the 687.53 support for a more discounted entry
DCA Levels: If the broader market dips further, scaling in closer to the 687–690 support pocket makes logical sense based on the visible extension levels
Stop Loss: A clean invalidation would be a breakdown below the recent swing low structure beneath 685, keeping risk tight👍
TP1: First realistic resistance target sits back near the 705.50 (1.618 Fib) level
TP2: Extended target up toward the 716.60 (1.0 Fib) resistance zone if bullish momentum expands
Personal Trading Perspective✅
My technical read is that BNB is trying to build a base after a sharp rejection, but it hasn't confirmed a full trend reversal yet. I want to see if the EMA cluster can hold as immediate support. If it loses this footing, I'm fully prepared to step aside and wait for a deeper retest. Markets don't owe us a trade, so patience is key here
What are your thoughts on BNB here are you looking to catch a bounce off these EMAs, or are you expecting another sweep of the lows? 🤔
#JobsReportRaisesHikeOdds
6
391
·
--
Article
$DOGEUSDT : a Critical Recovery Attempt Is Developing, But Bulls Still Have Something to Prove👍$DOGE is showing early signs of stabilization after a sharp corrective move on the 1-hour chart. The recent selloff pushed price significantly lower, but buyers have started stepping in around the $0.0706–$0.0720 region, triggering a short-term recovery toward $0.07287
however, I wouldn't call this a confirmed bullish reversal just yet. The broader structure still reflects the damage caused by the previous downside move, and DOGE needs to reclaim several important resistance levels before the recovery becomes convincing
📊Current Price Action & Market Structure
DOGE is currently trading around $0.07287 (+0.15%), with a visible 24-hour high of $0.07333 and low of $0.07015
what stands out to me is the sharp breakdown from the previous $0.0750–$0.0760 region. Selling pressure accelerated, pushing price toward the lower Fibonacci extension levels before buyers attempted a rebound
interesting part is that price is now recovering from that local low, but the bounce is still relatively small compared with the preceding decline. This makes the current area an important decision zone
Here Is What the Indicators Are Suggesting
1\. EMA Structure
The visible EMA values are:
EMA7: $0.07265
EMA14: $0.07249
EMA28: $0.07284
Price has reclaimed EMA7 and EMA14, which suggests improving short-term momentum. However, EMA28 remains an immediate resistance area, sitting almost exactly at the current price. I want to see DOGE establish a sustained position above $0.07284 rather than simply touching it😎
2\. Fibonacci Levels
The Fibonacci extensions are particularly interesting here:
1.618: $0.07302
2.618: $0.07283
3.618: $0.07064
DOGE is currently trading just above the 2.618 extension. This makes $0.07283 an important short-term decision level. sustained recovery above $0.07302 could improve the bullish structure, while losing the current extension area would increase the possibility of another downside test
3\. MACD Momentum
DIF is at -0.00027, while DEA is at -0.00055. The MACD histogram is approximately 0.00027
MACD lines are showing an improving short-term momentum structure, with DIF above DEA. That's encouraging, but both lines remain below zero
For me, this is an early recovery signal, not confirmation that the larger bearish momentum has completely disappeared
4\. RSI & Volume
RSI6 is 63.74, RSI12 is 52.81, and RSI24 is 46.51
short-term momentum has improved considerably, although the longer RSI readings remain relatively weaker
Volume is currently 18.41M, compared with MA5 at 63.30M and MA10 at 45.81M. This is something I don't want to ignore. The recovery is happening without strong volume participation, so buyers still need to demonstrate stronger commitment
🎯 Key Price Levels
Support:🟢
$0.07283 – Immediate Fibonacci support
$0.07064 – Important downside extension and recovery invalidation area
Resistance: 🔴
$0.07284 – EMA28 resistance.
$0.07302 – Fibonacci 1.618 extension.
$0.07333 – Visible 24-hour high.
$0.07537 – Major Fibonacci recovery level.
What Comes Next?
Bearish Scenario: If DOGE loses $0.07283 and fails to reclaim it, the current recovery could turn into another temporary bounce. That would expose the $0.07064 extension, where buyers would need to defend the structure again
Bullish Scenario: If buyers reclaim $0.07302 and break above $0.07333 with stronger volume, the recovery could gain momentum. A sustained move toward $0.07537 would then become a more realistic technical possibility
My Market Perspective
My current read is that DOGE is attempting a short-term recovery after a significant downside move, but the confirmation is still missing. What concerns me most is the relatively weak volume behind this bounce. RSI and MACD are improving, but I don't want to confuse improving momentum with a fully established trend reversal
Personally, I would watch the $0.07283–$0.07333 region very closely. If DOGE can reclaim this area and hold it with meaningful buying participation, I would become more comfortable considering bullish opportunities.
I would not rush into an entry simply because the candles have started turning green. Patience matters here, especially after such an aggressive decline. For now, confirmation is more important than anticipation. I could be wrong, but I would rather miss the first part of a recovery than enter blindly into another rejection.
Trading Strategy: I would wait for confirmation above $0.07333 before considering a momentum-based long. A breakdown below $0.07283 would make me cautious, with $0.07064 as the next important level to monitor. No forced DCA until the support structure becomes clearer.....🤔
$DOGEUSDT : a Critical Recovery Attempt Is Developing, But Bulls Still Have Something to Prove👍
$DOGE is showing early signs of stabilization after a sharp corrective move on the 1-hour chart. The recent selloff pushed price significantly lower, but buyers have started stepping in around the $0.0706–$0.0720 region, triggering a short-term recovery toward $0.07287
however, I wouldn't call this a confirmed bullish reversal just yet. The broader structure still reflects the damage caused by the previous downside move, and DOGE needs to reclaim several important resistance levels before the recovery becomes convincing
📊Current Price Action & Market Structure
DOGE is currently trading around $0.07287 (+0.15%), with a visible 24-hour high of $0.07333 and low of $0.07015
what stands out to me is the sharp breakdown from the previous $0.0750–$0.0760 region. Selling pressure accelerated, pushing price toward the lower Fibonacci extension levels before buyers attempted a rebound
interesting part is that price is now recovering from that local low, but the bounce is still relatively small compared with the preceding decline. This makes the current area an important decision zone
Here Is What the Indicators Are Suggesting
1\. EMA Structure
The visible EMA values are:
EMA7: $0.07265
EMA14: $0.07249
EMA28: $0.07284
Price has reclaimed EMA7 and EMA14, which suggests improving short-term momentum. However, EMA28 remains an immediate resistance area, sitting almost exactly at the current price. I want to see DOGE establish a sustained position above $0.07284 rather than simply touching it😎
2\. Fibonacci Levels
The Fibonacci extensions are particularly interesting here:
1.618: $0.07302
2.618: $0.07283
3.618: $0.07064
DOGE is currently trading just above the 2.618 extension. This makes $0.07283 an important short-term decision level. sustained recovery above $0.07302 could improve the bullish structure, while losing the current extension area would increase the possibility of another downside test
3\. MACD Momentum
DIF is at -0.00027, while DEA is at -0.00055. The MACD histogram is approximately 0.00027
MACD lines are showing an improving short-term momentum structure, with DIF above DEA. That's encouraging, but both lines remain below zero
For me, this is an early recovery signal, not confirmation that the larger bearish momentum has completely disappeared
4\. RSI & Volume
RSI6 is 63.74, RSI12 is 52.81, and RSI24 is 46.51
short-term momentum has improved considerably, although the longer RSI readings remain relatively weaker
Volume is currently 18.41M, compared with MA5 at 63.30M and MA10 at 45.81M. This is something I don't want to ignore. The recovery is happening without strong volume participation, so buyers still need to demonstrate stronger commitment
🎯 Key Price Levels
Support:🟢
$0.07283 – Immediate Fibonacci support
$0.07064 – Important downside extension and recovery invalidation area
Resistance: 🔴
$0.07284 – EMA28 resistance.
$0.07302 – Fibonacci 1.618 extension.
$0.07333 – Visible 24-hour high.
$0.07537 – Major Fibonacci recovery level.
What Comes Next?
Bearish Scenario: If DOGE loses $0.07283 and fails to reclaim it, the current recovery could turn into another temporary bounce. That would expose the $0.07064 extension, where buyers would need to defend the structure again
Bullish Scenario: If buyers reclaim $0.07302 and break above $0.07333 with stronger volume, the recovery could gain momentum. A sustained move toward $0.07537 would then become a more realistic technical possibility
My Market Perspective
My current read is that DOGE is attempting a short-term recovery after a significant downside move, but the confirmation is still missing. What concerns me most is the relatively weak volume behind this bounce. RSI and MACD are improving, but I don't want to confuse improving momentum with a fully established trend reversal
Personally, I would watch the $0.07283–$0.07333 region very closely. If DOGE can reclaim this area and hold it with meaningful buying participation, I would become more comfortable considering bullish opportunities.
I would not rush into an entry simply because the candles have started turning green. Patience matters here, especially after such an aggressive decline. For now, confirmation is more important than anticipation. I could be wrong, but I would rather miss the first part of a recovery than enter blindly into another rejection.
Trading Strategy: I would wait for confirmation above $0.07333 before considering a momentum-based long. A breakdown below $0.07283 would make me cautious, with $0.07064 as the next important level to monitor. No forced DCA until the support structure becomes clearer.....🤔
however, I wouldn't call this a confirmed bullish reversal just yet. The broader structure still reflects the damage caused by the previous downside move, and DOGE needs to reclaim several important resistance levels before the recovery becomes convincing
📊Current Price Action & Market Structure
DOGE is currently trading around $0.07287 (+0.15%), with a visible 24-hour high of $0.07333 and low of $0.07015
what stands out to me is the sharp breakdown from the previous $0.0750–$0.0760 region. Selling pressure accelerated, pushing price toward the lower Fibonacci extension levels before buyers attempted a rebound
interesting part is that price is now recovering from that local low, but the bounce is still relatively small compared with the preceding decline. This makes the current area an important decision zone
Here Is What the Indicators Are Suggesting
1\. EMA Structure
The visible EMA values are:
EMA7: $0.07265
EMA14: $0.07249
EMA28: $0.07284
Price has reclaimed EMA7 and EMA14, which suggests improving short-term momentum. However, EMA28 remains an immediate resistance area, sitting almost exactly at the current price. I want to see DOGE establish a sustained position above $0.07284 rather than simply touching it😎
2\. Fibonacci Levels
The Fibonacci extensions are particularly interesting here:
1.618: $0.07302
2.618: $0.07283
3.618: $0.07064
DOGE is currently trading just above the 2.618 extension. This makes $0.07283 an important short-term decision level. sustained recovery above $0.07302 could improve the bullish structure, while losing the current extension area would increase the possibility of another downside test
3\. MACD Momentum
DIF is at -0.00027, while DEA is at -0.00055. The MACD histogram is approximately 0.00027
MACD lines are showing an improving short-term momentum structure, with DIF above DEA. That's encouraging, but both lines remain below zero
For me, this is an early recovery signal, not confirmation that the larger bearish momentum has completely disappeared
4\. RSI & Volume
RSI6 is 63.74, RSI12 is 52.81, and RSI24 is 46.51
short-term momentum has improved considerably, although the longer RSI readings remain relatively weaker
Volume is currently 18.41M, compared with MA5 at 63.30M and MA10 at 45.81M. This is something I don't want to ignore. The recovery is happening without strong volume participation, so buyers still need to demonstrate stronger commitment
🎯 Key Price Levels
Support:🟢
$0.07283 – Immediate Fibonacci support
$0.07064 – Important downside extension and recovery invalidation area
Resistance: 🔴
$0.07284 – EMA28 resistance.
$0.07302 – Fibonacci 1.618 extension.
$0.07333 – Visible 24-hour high.
$0.07537 – Major Fibonacci recovery level.
What Comes Next?
Bearish Scenario: If DOGE loses $0.07283 and fails to reclaim it, the current recovery could turn into another temporary bounce. That would expose the $0.07064 extension, where buyers would need to defend the structure again
Bullish Scenario: If buyers reclaim $0.07302 and break above $0.07333 with stronger volume, the recovery could gain momentum. A sustained move toward $0.07537 would then become a more realistic technical possibility
My Market Perspective
My current read is that DOGE is attempting a short-term recovery after a significant downside move, but the confirmation is still missing. What concerns me most is the relatively weak volume behind this bounce. RSI and MACD are improving, but I don't want to confuse improving momentum with a fully established trend reversal
Personally, I would watch the $0.07283–$0.07333 region very closely. If DOGE can reclaim this area and hold it with meaningful buying participation, I would become more comfortable considering bullish opportunities.
I would not rush into an entry simply because the candles have started turning green. Patience matters here, especially after such an aggressive decline. For now, confirmation is more important than anticipation. I could be wrong, but I would rather miss the first part of a recovery than enter blindly into another rejection.
Trading Strategy: I would wait for confirmation above $0.07333 before considering a momentum-based long. A breakdown below $0.07283 would make me cautious, with $0.07064 as the next important level to monitor. No forced DCA until the support structure becomes clearer.....🤔
1
8
1.1k
·
--

Article
PEPE LONG 🟢$PEPE is showing signs of a strong recovery attempt after a sharp corrective phase. The asset has bounced aggressively from local lows and is trying to reclaim key structural levels on the 1h timeframe, driven by an influx of short-term momentum and buying interest
Current Price Action
current trading price is sitting at 0.0050330, reflecting a +1.55% gain on the session. Looking at the recent structure, the asset carved out a swing low down near 0.0046260, before rallying sharply to test a recent swing high near 0.0053150. The recent price movement shows aggressive bullish expansion following a deeper pullback. Price is currently pushing above short-term moving averages, testing an extension zone as buyers attempt to establish continuation rather than just a temporary relief bounce
Here Is What the Indicators Are Suggesting
Moving Averages / EMA: Price is currently trading above the visible EMAs. The EMA7 is at 0.0049868, EMA14 is at 0.0049409, and EMA28 is at 0.0049181. With price positioned above all three short-term lines and the faster EMAs sloping upward, short-term momentum has flipped bullish, turning the immediate EMA stack into dynamic support
MACD: The MACD indicator displays visible positive momentum. DIF is at 0.0000307, DEA is at 0.0000028, and the MACD histogram shows a positive value of 0.0000027. This points to a bullish crossover with expanding histogram bars, confirming that buying pressure is currently driving the momentum
RSI: The RSI values show neutral-to-bullish conditions without extreme overbought readings yet: RSI6 is at 67.87, RSI12 is at 62.94, and RSI24 is at 56.59. This indicates healthy upward momentum, though RSI6 is approaching the upper boundary, meaning minor consolidation or cooling off could happen soon
Volume Analysis: Volume data shows a current volume reading of 997.19M, sitting above the Volume Moving Averages (MA5 at 939.97M and MA10 at 676.38M). This expansion in volume relative to the moving averages suggests that the current upward push is supported by genuine market participation rather than a low-liquidity fakeout
Key Price Levels
Support:
Immediate support: ~0.0049705 (aligned closely with the fast EMA cluster)
Major structural support: ~0.0047982 (the reaction zone prior to the latest impulsive leg up)
Critical breakdown level: ~0.0046260 (the recent swing low; losing this invalidates the recovery structure)
Resistance:
Immediate overhead resistance: ~0.0051427 (local intraday pivot)
Major trend-defining resistance: ~0.0053150 (the recent swing high and primary ceiling for the current move)
What Comes Next?
Bullish Scenario: If buyers continue to defend the EMA cluster and immediate support around 0.00497, momentum could push the asset back toward the 0.00514 pivot, with a clear path to retest the major high at 0.005315. A high-volume breakout above that ceiling would confirm trend continuation
bearish Scenario: If the current buying pressure fades and price slips below the EMA stack and the 0.00497 support level, expect a retest of the deeper structural support at 0.004798. A breakdown beneath that zone would invite profit-taking and risk a sweep toward the 0.004626 swing low
My Market Perspective
my current read is that PEPE is seeing a solid impulsive recovery, but it is running into a crucial transition area. What concerns me most is whether the volume backing this move can sustain a push past the local highs without getting exhausted. The most important thing I am watching is how price behaves around the 0.00514 to 0.005315 resistance band
I would not rush into an entry right here in the middle of the range, especially with RSI6 climbing near the upper 60s. For me, patience is the better strategy. Until price confirms a clean acceptance above resistance or gives a healthy, low-volume retest of the EMA support cluster, I prefer to stay on the sidelines and avoid chasing green candles. Risk management comes first—if I look for a long entry, my invalidation must sit tightly below the recent structural lows
Trading Strategy
Entry Zone: 0.004920 - 0.004980 (on a healthy pullback to the EMA confluence)
DCA Levels: 0.004790 (near major structural support)
Stop Loss: 0.004610 (just below the recent swing low)
TP1: 0.005140
TP2: 0.005315
TP3: 0.005450
#BinanceReopensWithdrawalsForMoreAssets
PEPE LONG 🟢
$PEPE is showing signs of a strong recovery attempt after a sharp corrective phase. The asset has bounced aggressively from local lows and is trying to reclaim key structural levels on the 1h timeframe, driven by an influx of short-term momentum and buying interest
Current Price Action
current trading price is sitting at 0.0050330, reflecting a +1.55% gain on the session. Looking at the recent structure, the asset carved out a swing low down near 0.0046260, before rallying sharply to test a recent swing high near 0.0053150. The recent price movement shows aggressive bullish expansion following a deeper pullback. Price is currently pushing above short-term moving averages, testing an extension zone as buyers attempt to establish continuation rather than just a temporary relief bounce
Here Is What the Indicators Are Suggesting
Moving Averages / EMA: Price is currently trading above the visible EMAs. The EMA7 is at 0.0049868, EMA14 is at 0.0049409, and EMA28 is at 0.0049181. With price positioned above all three short-term lines and the faster EMAs sloping upward, short-term momentum has flipped bullish, turning the immediate EMA stack into dynamic support
MACD: The MACD indicator displays visible positive momentum. DIF is at 0.0000307, DEA is at 0.0000028, and the MACD histogram shows a positive value of 0.0000027. This points to a bullish crossover with expanding histogram bars, confirming that buying pressure is currently driving the momentum
RSI: The RSI values show neutral-to-bullish conditions without extreme overbought readings yet: RSI6 is at 67.87, RSI12 is at 62.94, and RSI24 is at 56.59. This indicates healthy upward momentum, though RSI6 is approaching the upper boundary, meaning minor consolidation or cooling off could happen soon
Volume Analysis: Volume data shows a current volume reading of 997.19M, sitting above the Volume Moving Averages (MA5 at 939.97M and MA10 at 676.38M). This expansion in volume relative to the moving averages suggests that the current upward push is supported by genuine market participation rather than a low-liquidity fakeout
Key Price Levels
Support:
Immediate support: ~0.0049705 (aligned closely with the fast EMA cluster)
Major structural support: ~0.0047982 (the reaction zone prior to the latest impulsive leg up)
Critical breakdown level: ~0.0046260 (the recent swing low; losing this invalidates the recovery structure)
Resistance:
Immediate overhead resistance: ~0.0051427 (local intraday pivot)
Major trend-defining resistance: ~0.0053150 (the recent swing high and primary ceiling for the current move)
What Comes Next?
Bullish Scenario: If buyers continue to defend the EMA cluster and immediate support around 0.00497, momentum could push the asset back toward the 0.00514 pivot, with a clear path to retest the major high at 0.005315. A high-volume breakout above that ceiling would confirm trend continuation
bearish Scenario: If the current buying pressure fades and price slips below the EMA stack and the 0.00497 support level, expect a retest of the deeper structural support at 0.004798. A breakdown beneath that zone would invite profit-taking and risk a sweep toward the 0.004626 swing low
My Market Perspective
my current read is that PEPE is seeing a solid impulsive recovery, but it is running into a crucial transition area. What concerns me most is whether the volume backing this move can sustain a push past the local highs without getting exhausted. The most important thing I am watching is how price behaves around the 0.00514 to 0.005315 resistance band
I would not rush into an entry right here in the middle of the range, especially with RSI6 climbing near the upper 60s. For me, patience is the better strategy. Until price confirms a clean acceptance above resistance or gives a healthy, low-volume retest of the EMA support cluster, I prefer to stay on the sidelines and avoid chasing green candles. Risk management comes first—if I look for a long entry, my invalidation must sit tightly below the recent structural lows
Trading Strategy
Entry Zone: 0.004920 - 0.004980 (on a healthy pullback to the EMA confluence)
DCA Levels: 0.004790 (near major structural support)
Stop Loss: 0.004610 (just below the recent swing low)
TP1: 0.005140
TP2: 0.005315
TP3: 0.005450
#BinanceReopensWithdrawalsForMoreAssets
Current Price Action
current trading price is sitting at 0.0050330, reflecting a +1.55% gain on the session. Looking at the recent structure, the asset carved out a swing low down near 0.0046260, before rallying sharply to test a recent swing high near 0.0053150. The recent price movement shows aggressive bullish expansion following a deeper pullback. Price is currently pushing above short-term moving averages, testing an extension zone as buyers attempt to establish continuation rather than just a temporary relief bounce
Here Is What the Indicators Are Suggesting
Moving Averages / EMA: Price is currently trading above the visible EMAs. The EMA7 is at 0.0049868, EMA14 is at 0.0049409, and EMA28 is at 0.0049181. With price positioned above all three short-term lines and the faster EMAs sloping upward, short-term momentum has flipped bullish, turning the immediate EMA stack into dynamic support
MACD: The MACD indicator displays visible positive momentum. DIF is at 0.0000307, DEA is at 0.0000028, and the MACD histogram shows a positive value of 0.0000027. This points to a bullish crossover with expanding histogram bars, confirming that buying pressure is currently driving the momentum
RSI: The RSI values show neutral-to-bullish conditions without extreme overbought readings yet: RSI6 is at 67.87, RSI12 is at 62.94, and RSI24 is at 56.59. This indicates healthy upward momentum, though RSI6 is approaching the upper boundary, meaning minor consolidation or cooling off could happen soon
Volume Analysis: Volume data shows a current volume reading of 997.19M, sitting above the Volume Moving Averages (MA5 at 939.97M and MA10 at 676.38M). This expansion in volume relative to the moving averages suggests that the current upward push is supported by genuine market participation rather than a low-liquidity fakeout
Key Price Levels
Support:
Immediate support: ~0.0049705 (aligned closely with the fast EMA cluster)
Major structural support: ~0.0047982 (the reaction zone prior to the latest impulsive leg up)
Critical breakdown level: ~0.0046260 (the recent swing low; losing this invalidates the recovery structure)
Resistance:
Immediate overhead resistance: ~0.0051427 (local intraday pivot)
Major trend-defining resistance: ~0.0053150 (the recent swing high and primary ceiling for the current move)
What Comes Next?
Bullish Scenario: If buyers continue to defend the EMA cluster and immediate support around 0.00497, momentum could push the asset back toward the 0.00514 pivot, with a clear path to retest the major high at 0.005315. A high-volume breakout above that ceiling would confirm trend continuation
bearish Scenario: If the current buying pressure fades and price slips below the EMA stack and the 0.00497 support level, expect a retest of the deeper structural support at 0.004798. A breakdown beneath that zone would invite profit-taking and risk a sweep toward the 0.004626 swing low
My Market Perspective
my current read is that PEPE is seeing a solid impulsive recovery, but it is running into a crucial transition area. What concerns me most is whether the volume backing this move can sustain a push past the local highs without getting exhausted. The most important thing I am watching is how price behaves around the 0.00514 to 0.005315 resistance band
I would not rush into an entry right here in the middle of the range, especially with RSI6 climbing near the upper 60s. For me, patience is the better strategy. Until price confirms a clean acceptance above resistance or gives a healthy, low-volume retest of the EMA support cluster, I prefer to stay on the sidelines and avoid chasing green candles. Risk management comes first—if I look for a long entry, my invalidation must sit tightly below the recent structural lows
Trading Strategy
Entry Zone: 0.004920 - 0.004980 (on a healthy pullback to the EMA confluence)
DCA Levels: 0.004790 (near major structural support)
Stop Loss: 0.004610 (just below the recent swing low)
TP1: 0.005140
TP2: 0.005315
TP3: 0.005450
#BinanceReopensWithdrawalsForMoreAssets
7
431
·
--

Article
What on earth is happening in the financial markets right now ?Honestly, this is becoming one of the most difficult periods to navigate, not just for stock investors but for crypto traders as well. The combination of political uncertainty, Trump's influence over government decisions, shifting economic expectations, and growing market anxiety is creating an environment where confidence can disappear incredibly fast.
And the consequences are showing up everywhere.
Stocks and Crypto Are Feeling the Pressure
what concerns me most is how quickly sentiment has changed. Investors who were comfortable holding risk asets are suddenly becoming more defensive. When uncertainty increases around government policy, trade decisions, economic direction, and interest rates, traditional markets can react aggressively. The stock market is particularly sensitive to these developments because large companies depend on stable economic conditions, predictable policies, and investor confidence.
But crypto is not isolated from that environment.
Bitcoin and the broader cryptocurrency market are still heavily influenced by global liquidity and overall risk appetite. When investors start reducing exposure to risky assets, crypto often feels the pressure alongside technology stocks and other growth-oriented investments. That is why we can see selling pressure across multiple markets at the same time.
$1 BILLION+ LIQUIDATIONS. That's Not Something to Ignore. 🔴
The liquidation figure makes the situation even more concerning.
When more than $1 billion in leveraged positions gets liquidated, it shows how dangerous excessive leverage can become during sudden market movements. Long positions can get wiped out when prices fall sharply. Then, if the market rebounds aggressively, overleveraged short positions can become the next targets.
This creates a chain reaction.
price drops trigger liquidations, liquidations add further selling pressure, and panic encourages more traders to exit their positions. Before long, the market can move much further than many participants expected. However, I would separate forced liquidations from genuine long-term selling. They are not necessarily the same thing.
What Am I Watching Now?
I am not interested in blindly buying every dip, but I am also not convinced that every sharp correction means the entire market cycle is finished.
My focus is on three things.
First, whether Bitcoin can establish a meaningful support zone instead of continuing to print lower lows.
Second, whether traditional stock markets can regain stability. A sustained recovery in risk sentiment could help crypto as well.
Third, whether liquidation pressure starts cooling down. Until excessive leverage is cleared, sudden volatility can remain a serious problem.
for now, capital preservation matters more to me than trying to catch every falling candle.
I would rather miss the first part of a recovery than enter too early and get caught in another liquidation wave.
My Personal Trading Strategy
I am keeping my leverage low, avoiding emotional entries, and watching important support and resistance levels before making decisions. If the market stabilizes, I will look for confirmation before considering new positions. If selling pressure continues, I am comfortable staying patient and keeping some capital available for better opportunities. One thing is certain: political headlines can change market sentiment quickly, but price action still needs to confirm the direction.
This is a market where risk management is not optional.
what do you think is driving this situation more right now: Trump's political influence, macroeconomic uncertainty, institutional selling, or excessive leverage across the financial markets?
Are we looking at a temporary liquidity shock, or could this be the beginning of a much deeper correction?
Let's hear your thoughts.
$AAPLB
{spot}(AAPLBUSDT)
$NVDAB
{spot}(NVDABUSDT)
$MSFTB
{spot}(MSFTBUSDT)
#BinanceReopensWithdrawalsForMoreAssets
What on earth is happening in the financial markets right now ?
Honestly, this is becoming one of the most difficult periods to navigate, not just for stock investors but for crypto traders as well. The combination of political uncertainty, Trump's influence over government decisions, shifting economic expectations, and growing market anxiety is creating an environment where confidence can disappear incredibly fast.
And the consequences are showing up everywhere.
Stocks and Crypto Are Feeling the Pressure
what concerns me most is how quickly sentiment has changed. Investors who were comfortable holding risk asets are suddenly becoming more defensive. When uncertainty increases around government policy, trade decisions, economic direction, and interest rates, traditional markets can react aggressively. The stock market is particularly sensitive to these developments because large companies depend on stable economic conditions, predictable policies, and investor confidence.
But crypto is not isolated from that environment.
Bitcoin and the broader cryptocurrency market are still heavily influenced by global liquidity and overall risk appetite. When investors start reducing exposure to risky assets, crypto often feels the pressure alongside technology stocks and other growth-oriented investments. That is why we can see selling pressure across multiple markets at the same time.
$1 BILLION+ LIQUIDATIONS. That's Not Something to Ignore. 🔴
The liquidation figure makes the situation even more concerning.
When more than $1 billion in leveraged positions gets liquidated, it shows how dangerous excessive leverage can become during sudden market movements. Long positions can get wiped out when prices fall sharply. Then, if the market rebounds aggressively, overleveraged short positions can become the next targets.
This creates a chain reaction.
price drops trigger liquidations, liquidations add further selling pressure, and panic encourages more traders to exit their positions. Before long, the market can move much further than many participants expected. However, I would separate forced liquidations from genuine long-term selling. They are not necessarily the same thing.
What Am I Watching Now?
I am not interested in blindly buying every dip, but I am also not convinced that every sharp correction means the entire market cycle is finished.
My focus is on three things.
First, whether Bitcoin can establish a meaningful support zone instead of continuing to print lower lows.
Second, whether traditional stock markets can regain stability. A sustained recovery in risk sentiment could help crypto as well.
Third, whether liquidation pressure starts cooling down. Until excessive leverage is cleared, sudden volatility can remain a serious problem.
for now, capital preservation matters more to me than trying to catch every falling candle.
I would rather miss the first part of a recovery than enter too early and get caught in another liquidation wave.
My Personal Trading Strategy
I am keeping my leverage low, avoiding emotional entries, and watching important support and resistance levels before making decisions. If the market stabilizes, I will look for confirmation before considering new positions. If selling pressure continues, I am comfortable staying patient and keeping some capital available for better opportunities. One thing is certain: political headlines can change market sentiment quickly, but price action still needs to confirm the direction.
This is a market where risk management is not optional.
what do you think is driving this situation more right now: Trump's political influence, macroeconomic uncertainty, institutional selling, or excessive leverage across the financial markets?
Are we looking at a temporary liquidity shock, or could this be the beginning of a much deeper correction?
Let's hear your thoughts.
$AAPLB
$NVDAB
$MSFTB
#BinanceReopensWithdrawalsForMoreAssets
And the consequences are showing up everywhere.
Stocks and Crypto Are Feeling the Pressure
what concerns me most is how quickly sentiment has changed. Investors who were comfortable holding risk asets are suddenly becoming more defensive. When uncertainty increases around government policy, trade decisions, economic direction, and interest rates, traditional markets can react aggressively. The stock market is particularly sensitive to these developments because large companies depend on stable economic conditions, predictable policies, and investor confidence.
But crypto is not isolated from that environment.
Bitcoin and the broader cryptocurrency market are still heavily influenced by global liquidity and overall risk appetite. When investors start reducing exposure to risky assets, crypto often feels the pressure alongside technology stocks and other growth-oriented investments. That is why we can see selling pressure across multiple markets at the same time.
$1 BILLION+ LIQUIDATIONS. That's Not Something to Ignore. 🔴
The liquidation figure makes the situation even more concerning.
When more than $1 billion in leveraged positions gets liquidated, it shows how dangerous excessive leverage can become during sudden market movements. Long positions can get wiped out when prices fall sharply. Then, if the market rebounds aggressively, overleveraged short positions can become the next targets.
This creates a chain reaction.
price drops trigger liquidations, liquidations add further selling pressure, and panic encourages more traders to exit their positions. Before long, the market can move much further than many participants expected. However, I would separate forced liquidations from genuine long-term selling. They are not necessarily the same thing.
What Am I Watching Now?
I am not interested in blindly buying every dip, but I am also not convinced that every sharp correction means the entire market cycle is finished.
My focus is on three things.
First, whether Bitcoin can establish a meaningful support zone instead of continuing to print lower lows.
Second, whether traditional stock markets can regain stability. A sustained recovery in risk sentiment could help crypto as well.
Third, whether liquidation pressure starts cooling down. Until excessive leverage is cleared, sudden volatility can remain a serious problem.
for now, capital preservation matters more to me than trying to catch every falling candle.
I would rather miss the first part of a recovery than enter too early and get caught in another liquidation wave.
My Personal Trading Strategy
I am keeping my leverage low, avoiding emotional entries, and watching important support and resistance levels before making decisions. If the market stabilizes, I will look for confirmation before considering new positions. If selling pressure continues, I am comfortable staying patient and keeping some capital available for better opportunities. One thing is certain: political headlines can change market sentiment quickly, but price action still needs to confirm the direction.
This is a market where risk management is not optional.
what do you think is driving this situation more right now: Trump's political influence, macroeconomic uncertainty, institutional selling, or excessive leverage across the financial markets?
Are we looking at a temporary liquidity shock, or could this be the beginning of a much deeper correction?
Let's hear your thoughts.
$AAPLB
$NVDAB
$MSFTB
#BinanceReopensWithdrawalsForMoreAssets
2
359
·
--

Article
NVIDIA UPDATE$NVDAXUSDT
momentum is heavily skewed following a sharp sell-off, and I am watching how price reacts around this current local base before making any structural decisions.
Price Action Analysis
pair recently topped out near the 211.51 swing high before a heavy impulsive breakdown sliced through intermediate levels down to a recent swing low of 179.65. Currently trading at 185.73, down 6.68% on the session, the price is attempting a minor relief bounce after testing that 179.65 floor. However, the broader trend on this 1-hour timeframe remains decidedly bearish, characterized by lower highs and aggressive expansion candles to the downside.
Technical Analysis
Looking at the visible Fibonacci retracement levels overlaid on the right side of the chart, price has retraced slightly from the lows and is currently hovering just beneath the 187.85 level. Overhead resistance is clearly stacked at 187.85, with major structural hurdles waiting higher up at 195.58 and 203.54. The sharp downward momentum indicates that sellers remain in control, and any minor upward drift looks corrective for now rather than a true trend reversal.
Strict Risk Management and Execution Plan
given the strong downward trajectory, I am avoiding blind dip-buying into a falling knife. Instead, I want to see if 187.85 acts as resistance or if price can sustain acceptance above it.
My Entry Strategy: I am currently sitting on my hands and waiting for confirmation. If price fails to reclaim the 187.85 level and prints a clear rejection wick or a lower-high continuation structure, I will look for a potential short entry setup aligned with the prevailing trend.
My Stop Loss: For a defensive short setup, a logical invalidation level would be placed just above the recent local structural pivot or above the 187.85 resistance line, ensuring my thesis is proven wrong if buyers manage a stronger squeeze.
My Risk Management: Capital preservation comes first in highvolatility conditions like this. If I take a position, I will limit my risk to 1-2% of total trading capital, ensuring that a sudden impulsive counter-trend spike cannot damage my account.
Personal Trading Psychology
I am not chasing the market, and I certainly do not catch faling knives blindly. The impulsive drop was severe, but patience is required. I respect the volatility, but I respect my capital more.
Targets and Trade Management
Since this is strictly a waiting setup and no execution has taken place, I am not mapping out fixed take-profit targets yet. Let the market show its hand first.
I am watching this level closely. I would rather miss a move than risk my capital without confirmation.
$NVDAB
{spot}(NVDABUSDT)
$AAPLB
{spot}(AAPLBUSDT)
#BinanceReopensWithdrawalsForMoreAssets
NVIDIA UPDATE
$NVDAXUSDT
momentum is heavily skewed following a sharp sell-off, and I am watching how price reacts around this current local base before making any structural decisions.
Price Action Analysis
pair recently topped out near the 211.51 swing high before a heavy impulsive breakdown sliced through intermediate levels down to a recent swing low of 179.65. Currently trading at 185.73, down 6.68% on the session, the price is attempting a minor relief bounce after testing that 179.65 floor. However, the broader trend on this 1-hour timeframe remains decidedly bearish, characterized by lower highs and aggressive expansion candles to the downside.
Technical Analysis
Looking at the visible Fibonacci retracement levels overlaid on the right side of the chart, price has retraced slightly from the lows and is currently hovering just beneath the 187.85 level. Overhead resistance is clearly stacked at 187.85, with major structural hurdles waiting higher up at 195.58 and 203.54. The sharp downward momentum indicates that sellers remain in control, and any minor upward drift looks corrective for now rather than a true trend reversal.
Strict Risk Management and Execution Plan
given the strong downward trajectory, I am avoiding blind dip-buying into a falling knife. Instead, I want to see if 187.85 acts as resistance or if price can sustain acceptance above it.
My Entry Strategy: I am currently sitting on my hands and waiting for confirmation. If price fails to reclaim the 187.85 level and prints a clear rejection wick or a lower-high continuation structure, I will look for a potential short entry setup aligned with the prevailing trend.
My Stop Loss: For a defensive short setup, a logical invalidation level would be placed just above the recent local structural pivot or above the 187.85 resistance line, ensuring my thesis is proven wrong if buyers manage a stronger squeeze.
My Risk Management: Capital preservation comes first in highvolatility conditions like this. If I take a position, I will limit my risk to 1-2% of total trading capital, ensuring that a sudden impulsive counter-trend spike cannot damage my account.
Personal Trading Psychology
I am not chasing the market, and I certainly do not catch faling knives blindly. The impulsive drop was severe, but patience is required. I respect the volatility, but I respect my capital more.
Targets and Trade Management
Since this is strictly a waiting setup and no execution has taken place, I am not mapping out fixed take-profit targets yet. Let the market show its hand first.
I am watching this level closely. I would rather miss a move than risk my capital without confirmation.
$NVDAB
$AAPLB
#BinanceReopensWithdrawalsForMoreAssets
momentum is heavily skewed following a sharp sell-off, and I am watching how price reacts around this current local base before making any structural decisions.
Price Action Analysis
pair recently topped out near the 211.51 swing high before a heavy impulsive breakdown sliced through intermediate levels down to a recent swing low of 179.65. Currently trading at 185.73, down 6.68% on the session, the price is attempting a minor relief bounce after testing that 179.65 floor. However, the broader trend on this 1-hour timeframe remains decidedly bearish, characterized by lower highs and aggressive expansion candles to the downside.
Technical Analysis
Looking at the visible Fibonacci retracement levels overlaid on the right side of the chart, price has retraced slightly from the lows and is currently hovering just beneath the 187.85 level. Overhead resistance is clearly stacked at 187.85, with major structural hurdles waiting higher up at 195.58 and 203.54. The sharp downward momentum indicates that sellers remain in control, and any minor upward drift looks corrective for now rather than a true trend reversal.
Strict Risk Management and Execution Plan
given the strong downward trajectory, I am avoiding blind dip-buying into a falling knife. Instead, I want to see if 187.85 acts as resistance or if price can sustain acceptance above it.
My Entry Strategy: I am currently sitting on my hands and waiting for confirmation. If price fails to reclaim the 187.85 level and prints a clear rejection wick or a lower-high continuation structure, I will look for a potential short entry setup aligned with the prevailing trend.
My Stop Loss: For a defensive short setup, a logical invalidation level would be placed just above the recent local structural pivot or above the 187.85 resistance line, ensuring my thesis is proven wrong if buyers manage a stronger squeeze.
My Risk Management: Capital preservation comes first in highvolatility conditions like this. If I take a position, I will limit my risk to 1-2% of total trading capital, ensuring that a sudden impulsive counter-trend spike cannot damage my account.
Personal Trading Psychology
I am not chasing the market, and I certainly do not catch faling knives blindly. The impulsive drop was severe, but patience is required. I respect the volatility, but I respect my capital more.
Targets and Trade Management
Since this is strictly a waiting setup and no execution has taken place, I am not mapping out fixed take-profit targets yet. Let the market show its hand first.
I am watching this level closely. I would rather miss a move than risk my capital without confirmation.
$NVDAB
$AAPLB
#BinanceReopensWithdrawalsForMoreAssets
1
402
·
--

Article
STOCK MARKET UPDATE TODAYThere are moments in the financial market when politics and money collide, and today's reported sell-off is a reminder of just how quickly sentiment can change. The Magnificent 7 stocks are facing significant selling pressure, with several of the biggest names in the US technology sector moving sharply lower.
Just look at the reported numbers:
Meta ($META): -3.13%
Tesla ($TSLA): -8.89%
Apple ($AAPL ): -0.73%
Nvidia ($NVDA ): -6.50%
Amazon ($AMZN ): -2.24%
Google ($GOOGL): -1.44%
Microsoft ($MSFT): -2.19%
According to the figures provided, more than $2.3 trillion in US stock market value has disappeared in a single day.
That's an enormous amount of capital. And when companies with this much influence start losing value together, the impact goes far beyond the technology sector. What makes this situation particularly interesting is the political backdrop. The reported Democratic victory in both chambers of Congress could introduce new uncertainty around future economic policies, regulation, taxation, and the broader business environment. However, I wouldn't automatically blame the entire market decline on election results. Markets are complicated. Political uncertainty, investor positioning, profit-taking, interest-rate expectations, and broader economic concerns can all influence market movements at the same time.
Tesla's nearly 9% decline and Nvidia's 6.5% drop are especialy noticeable. These are major companies that attract enormous investor attention. When sentiment around large-cap technology stocks changes, selling pressure can spread quickly.
Now here's the part I'm watching closely.
Could this become a temporary correction, or are investors beginning to reassess their exposure to expensive technology stocks?
That's an important distinction.
A sharp market decline doesn't necessarily mean the long-term story is over. But it does remind investors that even the strongest companies aren't immune to volatility. The market can remain optimistic for months and then change direction much faster than most people expect. I'm also keeping an eye on Bitcoin and the broader crypto market. Traditional financial markets and crypto don't always move together, but a major shift in global risk sentiment can influence both.
For now, I think patience matters more than emotional reactions. Rather than assuming every dip is a buying opportunity or every red candle signals a bigger crash, it's worth watching how the market responds over the next few sessions..One thing is clear: political developments and financial markets are becoming increasingly difficult to separate. Let's see whether investors find their confidence again or whether this selling pressure has more room to continue.
Follow for more market updates.
#BinanceReopensWithdrawalsForMoreAssets #Binance98PercentReplenished #StrategySTRCResumesIssuanceAfterOver170Days
STOCK MARKET UPDATE TODAY
There are moments in the financial market when politics and money collide, and today's reported sell-off is a reminder of just how quickly sentiment can change. The Magnificent 7 stocks are facing significant selling pressure, with several of the biggest names in the US technology sector moving sharply lower.
Just look at the reported numbers:
Meta ($META): -3.13%
Tesla ($TSLA): -8.89%
Apple ($AAPL ): -0.73%
Nvidia ($NVDA ): -6.50%
Amazon ($AMZN ): -2.24%
Google ($GOOGL): -1.44%
Microsoft ($MSFT): -2.19%
According to the figures provided, more than $2.3 trillion in US stock market value has disappeared in a single day.
That's an enormous amount of capital. And when companies with this much influence start losing value together, the impact goes far beyond the technology sector. What makes this situation particularly interesting is the political backdrop. The reported Democratic victory in both chambers of Congress could introduce new uncertainty around future economic policies, regulation, taxation, and the broader business environment. However, I wouldn't automatically blame the entire market decline on election results. Markets are complicated. Political uncertainty, investor positioning, profit-taking, interest-rate expectations, and broader economic concerns can all influence market movements at the same time.
Tesla's nearly 9% decline and Nvidia's 6.5% drop are especialy noticeable. These are major companies that attract enormous investor attention. When sentiment around large-cap technology stocks changes, selling pressure can spread quickly.
Now here's the part I'm watching closely.
Could this become a temporary correction, or are investors beginning to reassess their exposure to expensive technology stocks?
That's an important distinction.
A sharp market decline doesn't necessarily mean the long-term story is over. But it does remind investors that even the strongest companies aren't immune to volatility. The market can remain optimistic for months and then change direction much faster than most people expect. I'm also keeping an eye on Bitcoin and the broader crypto market. Traditional financial markets and crypto don't always move together, but a major shift in global risk sentiment can influence both.
For now, I think patience matters more than emotional reactions. Rather than assuming every dip is a buying opportunity or every red candle signals a bigger crash, it's worth watching how the market responds over the next few sessions..One thing is clear: political developments and financial markets are becoming increasingly difficult to separate. Let's see whether investors find their confidence again or whether this selling pressure has more room to continue.
Follow for more market updates.
#BinanceReopensWithdrawalsForMoreAssets #Binance98PercentReplenished #StrategySTRCResumesIssuanceAfterOver170Days
Just look at the reported numbers:
Meta ($META): -3.13%
Tesla ($TSLA): -8.89%
Apple ($AAPL ): -0.73%
Nvidia ($NVDA ): -6.50%
Amazon ($AMZN ): -2.24%
Google ($GOOGL): -1.44%
Microsoft ($MSFT): -2.19%
According to the figures provided, more than $2.3 trillion in US stock market value has disappeared in a single day.
That's an enormous amount of capital. And when companies with this much influence start losing value together, the impact goes far beyond the technology sector. What makes this situation particularly interesting is the political backdrop. The reported Democratic victory in both chambers of Congress could introduce new uncertainty around future economic policies, regulation, taxation, and the broader business environment. However, I wouldn't automatically blame the entire market decline on election results. Markets are complicated. Political uncertainty, investor positioning, profit-taking, interest-rate expectations, and broader economic concerns can all influence market movements at the same time.
Tesla's nearly 9% decline and Nvidia's 6.5% drop are especialy noticeable. These are major companies that attract enormous investor attention. When sentiment around large-cap technology stocks changes, selling pressure can spread quickly.
Now here's the part I'm watching closely.
Could this become a temporary correction, or are investors beginning to reassess their exposure to expensive technology stocks?
That's an important distinction.
A sharp market decline doesn't necessarily mean the long-term story is over. But it does remind investors that even the strongest companies aren't immune to volatility. The market can remain optimistic for months and then change direction much faster than most people expect. I'm also keeping an eye on Bitcoin and the broader crypto market. Traditional financial markets and crypto don't always move together, but a major shift in global risk sentiment can influence both.
For now, I think patience matters more than emotional reactions. Rather than assuming every dip is a buying opportunity or every red candle signals a bigger crash, it's worth watching how the market responds over the next few sessions..One thing is clear: political developments and financial markets are becoming increasingly difficult to separate. Let's see whether investors find their confidence again or whether this selling pressure has more room to continue.
Follow for more market updates.
#BinanceReopensWithdrawalsForMoreAssets #Binance98PercentReplenished #StrategySTRCResumesIssuanceAfterOver170Days
2
6
457
·
--
join here 🌹🤗🙋♀️🙋♀️
join here 🌹🤗🙋♀️🙋♀️

AloNe72
·
--
[Replay] 🎙️ FIX THE BINANCE GLITCH
02 h 33 m 49 s · 221 listens
2
107
Log in to explore more content
Join global crypto users on Binance Square
⚡️ Get latest and useful information about crypto.
💬 Trusted by the world’s largest crypto exchange.
👍 Discover real insights from verified creators.
Email / Phone number
Trending Topics
HotCPIDecemberHikePriced
368,906 views
3,424 Discussing
CPI Market Watch | US CPI Rises 0.4% in October, Hotter Than 0.3% Forecast
Binance News
·34 Likes
·49k views
ZcashFallsBelow$1000ForFirstTimeSinceSeptember
13,733 views
76 Discussing
StrategyFaces$2.8BSelloffRiskFromMSCIRemoval
24,831 views
151 Discussing