$USELESS This one is kind of interesting.
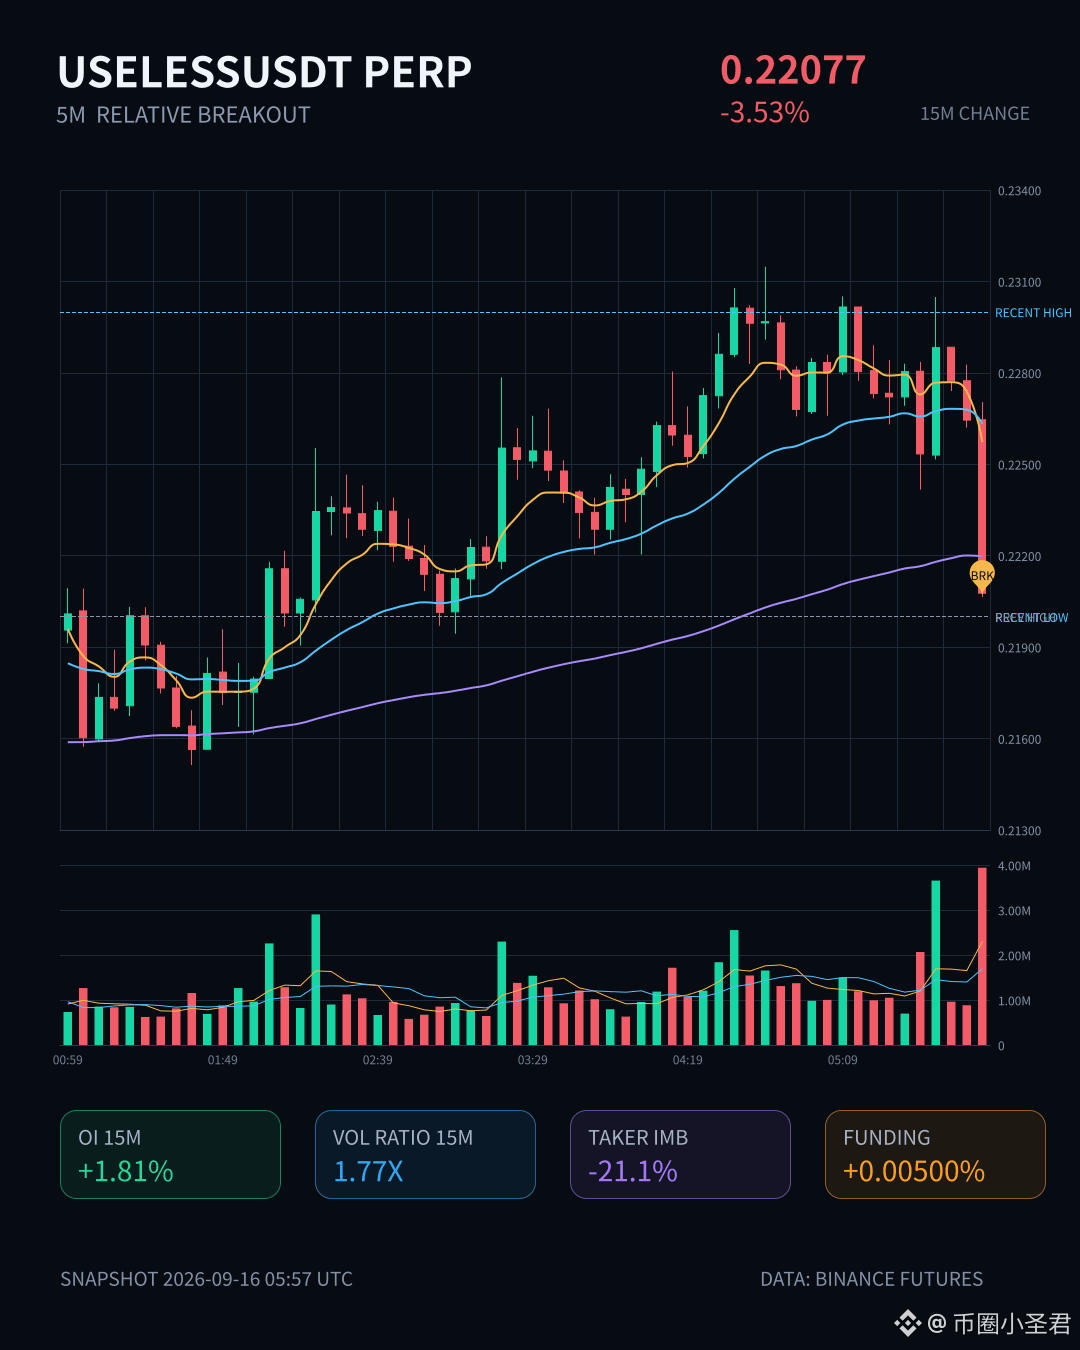
On the 15m chart, it directly dumped 3.53%. The volume hit 1.77x, and the Z value is 3.61—not that slow, annoying grind down. This was a volume-backed break below support.
The key is the OI. As the price falls, OI actually rises. On 15m: +1.81%, on 1h: +2.23%. The abnormal percentile is 91.1%, ranking #8 in the whole pool. This isn’t long-sided forced selling/cutting losses—it looks more like someone is adding leverage to short from this position. Active trade imbalance is -21.1%, buy/sell ratio 0.65, and sell pressure is clearly on one side.
The price has already broken below the lower edge of the last ~20 5m K candles. Don’t rush to catch it right after the breakdown—let it play out on its own. Be careful chasing shorts too. In the next 24h, there’s still 76.5M in trading value; liquidity is there, and a sudden wick can happen at any time.
Mostly watch the show—don’t get itchy to trade.
On the 15m chart, it directly dumped 3.53%. The volume hit 1.77x, and the Z value is 3.61—not that slow, annoying grind down. This was a volume-backed break below support.
The key is the OI. As the price falls, OI actually rises. On 15m: +1.81%, on 1h: +2.23%. The abnormal percentile is 91.1%, ranking #8 in the whole pool. This isn’t long-sided forced selling/cutting losses—it looks more like someone is adding leverage to short from this position. Active trade imbalance is -21.1%, buy/sell ratio 0.65, and sell pressure is clearly on one side.
The price has already broken below the lower edge of the last ~20 5m K candles. Don’t rush to catch it right after the breakdown—let it play out on its own. Be careful chasing shorts too. In the next 24h, there’s still 76.5M in trading value; liquidity is there, and a sudden wick can happen at any time.
Mostly watch the show—don’t get itchy to trade.