📉 XRP CRITICAL SUPPORT TEST: TECHNICAL BOUNCE OR BEARISH EXTENSION? ⚡
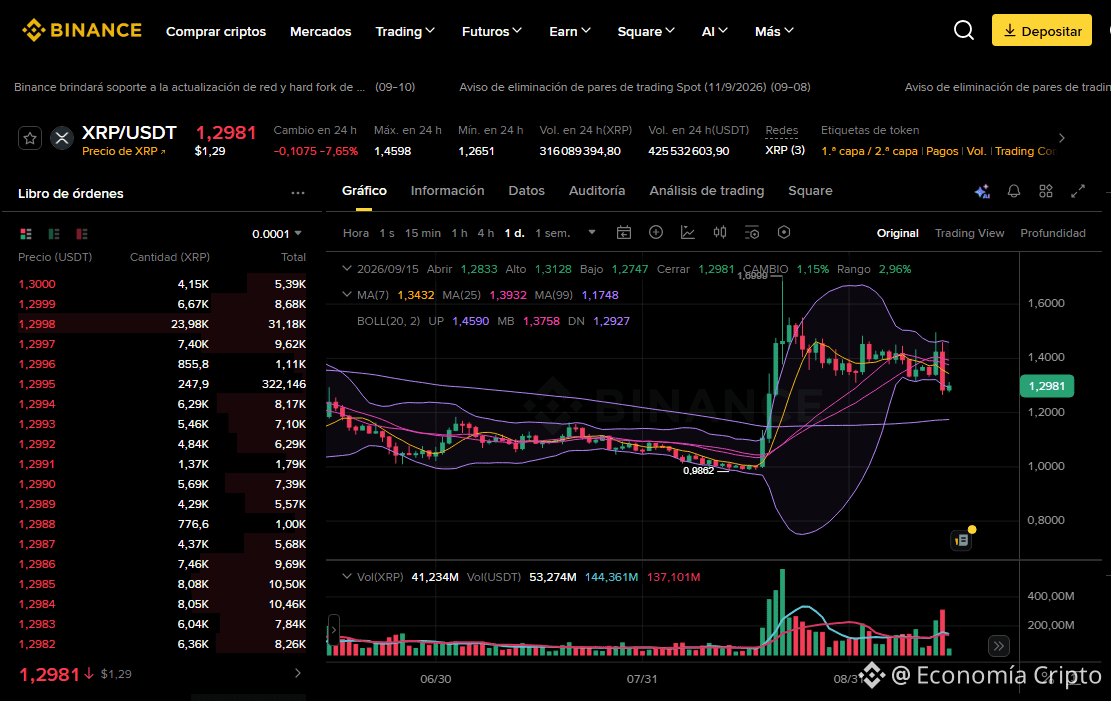
The XRP/USDT pair is trading at 1.2981, recording a -7.65% correction over the last 24 hours. The current daily session shows an attempt to stabilize, opening at 1.2833, with a high of 1.3128, a low of 1.2747, and a slight rebound of +1.15%, placing the price in a zone of high technical tension.
🔍 Trend Analysis and Indicators
Trend: Correction / Short-term consolidation seeking defense at key levels.
Moving Averages: The price is trading below the MA(7) (1.3432) and the MA(25) (1.3932), reflecting the recent pullback; however, the underlying macro structure remains supported as it is still comfortably above the MA(99) (1.1748).
Bollinger Bands: The quotation touches and presses the lower band zone DN: 1.2927 (with the middle band at MB: 1.3758 and the upper band at UP: 1.4590), indicating a temporary oversold scenario and a critical point where buying pressure must step in.
Key Levels: The structural base support sits solidly at 0.9862, while the main resistance to reclaim is at 1.6999.
💡 Trading Strategy: Buy or Sell?
Buy (Long)?: The test of the lower Bollinger band and the proximity to current support open the door to tactical bounce opportunities for risk-managed profiles, requiring strict risk management and a Stop Loss set below the session’s low.
Sell (Short)?: A clear, volume-backed breakdown below the lower band could extend the bearish leg in the short term, always operating prudently in light of the broader trend.
#XRP #AnalisisTecnico #CryptoTrading
The Lord blesses and prospers the one who operates here, in the name of Jesus, because your word says: "Mine is the silver, and mine is the gold, says the LORD of hosts". Hageo 2:8 RV1960-T -
$XRP
The XRP/USDT pair is trading at 1.2981, recording a -7.65% correction over the last 24 hours. The current daily session shows an attempt to stabilize, opening at 1.2833, with a high of 1.3128, a low of 1.2747, and a slight rebound of +1.15%, placing the price in a zone of high technical tension.
🔍 Trend Analysis and Indicators
Trend: Correction / Short-term consolidation seeking defense at key levels.
Moving Averages: The price is trading below the MA(7) (1.3432) and the MA(25) (1.3932), reflecting the recent pullback; however, the underlying macro structure remains supported as it is still comfortably above the MA(99) (1.1748).
Bollinger Bands: The quotation touches and presses the lower band zone DN: 1.2927 (with the middle band at MB: 1.3758 and the upper band at UP: 1.4590), indicating a temporary oversold scenario and a critical point where buying pressure must step in.
Key Levels: The structural base support sits solidly at 0.9862, while the main resistance to reclaim is at 1.6999.
💡 Trading Strategy: Buy or Sell?
Buy (Long)?: The test of the lower Bollinger band and the proximity to current support open the door to tactical bounce opportunities for risk-managed profiles, requiring strict risk management and a Stop Loss set below the session’s low.
Sell (Short)?: A clear, volume-backed breakdown below the lower band could extend the bearish leg in the short term, always operating prudently in light of the broader trend.
#XRP #AnalisisTecnico #CryptoTrading
The Lord blesses and prospers the one who operates here, in the name of Jesus, because your word says: "Mine is the silver, and mine is the gold, says the LORD of hosts". Hageo 2:8 RV1960-T -
$XRP