📉 BNB IN A DECISION ZONE: TECHNICAL BOUNCE OR CONSOLIDATION? ⚡
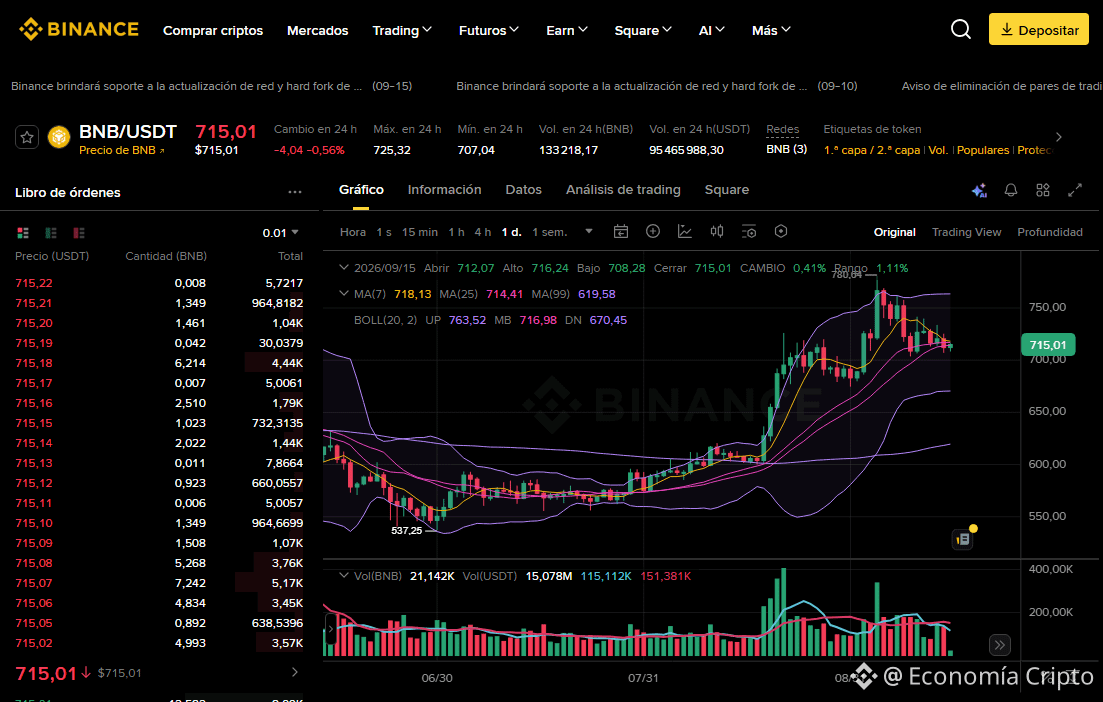
The BNB/USDT pair is trading at 715.01, recording a -0.56% variation over the last 24 hours. The current daily session shows a recovery move, opening at 712.07, reaching a high of 716.24 and a low of 708.28, placing the price at a key equilibrium point.
🔍 Trend Analysis and Indicators
Trend: Short-term consolidation within an overall stable structure.
Moving Averages: The current price is closely interacting with the fast MA(7) (718.13) and is holding just above the MA(25) (714.41), maintaining a solid underlying bullish structure while trading well above the MA(99) (619.58).
Bollinger Bands: The quotation is oscillating close to the middle line MB: 716.98 (with the upper band in UP: 763.52 and the lower band in DN: 670.45), indicating a pause in volatility and a neutral battleground between supply and demand.
Key Levels: The structural base support is firmly located at 537.25, while the immediate resistance to break is at 780.64.
💡 Trading Strategy: Buy or Sell?
Buy (Long)?: The confluence area between the 25 moving average and the Bollinger middle band represents an attractive technical zone to assess tactical entries or staggered buys on pullbacks, always applying strict risk management and an adjusted Stop Loss.
Sell (Short)?: A high-risk counter-trend trade due to the strength of the macro trend; it would only gain traction if price breaks through the immediate supports with volume.
#BNB #AnalisisTecnico #CryptoTrading
The Lord blesses and prospers whoever operates here, in the name of Jesus, because your word says: "Mine is the silver, and mine is the gold," says the LORD of hosts. Hageo 2:8 RV1960-T -
The BNB/USDT pair is trading at 715.01, recording a -0.56% variation over the last 24 hours. The current daily session shows a recovery move, opening at 712.07, reaching a high of 716.24 and a low of 708.28, placing the price at a key equilibrium point.
🔍 Trend Analysis and Indicators
Trend: Short-term consolidation within an overall stable structure.
Moving Averages: The current price is closely interacting with the fast MA(7) (718.13) and is holding just above the MA(25) (714.41), maintaining a solid underlying bullish structure while trading well above the MA(99) (619.58).
Bollinger Bands: The quotation is oscillating close to the middle line MB: 716.98 (with the upper band in UP: 763.52 and the lower band in DN: 670.45), indicating a pause in volatility and a neutral battleground between supply and demand.
Key Levels: The structural base support is firmly located at 537.25, while the immediate resistance to break is at 780.64.
💡 Trading Strategy: Buy or Sell?
Buy (Long)?: The confluence area between the 25 moving average and the Bollinger middle band represents an attractive technical zone to assess tactical entries or staggered buys on pullbacks, always applying strict risk management and an adjusted Stop Loss.
Sell (Short)?: A high-risk counter-trend trade due to the strength of the macro trend; it would only gain traction if price breaks through the immediate supports with volume.
#BNB #AnalisisTecnico #CryptoTrading
The Lord blesses and prospers whoever operates here, in the name of Jesus, because your word says: "Mine is the silver, and mine is the gold," says the LORD of hosts. Hageo 2:8 RV1960-T -