$PROM This spot is a bit interesting.
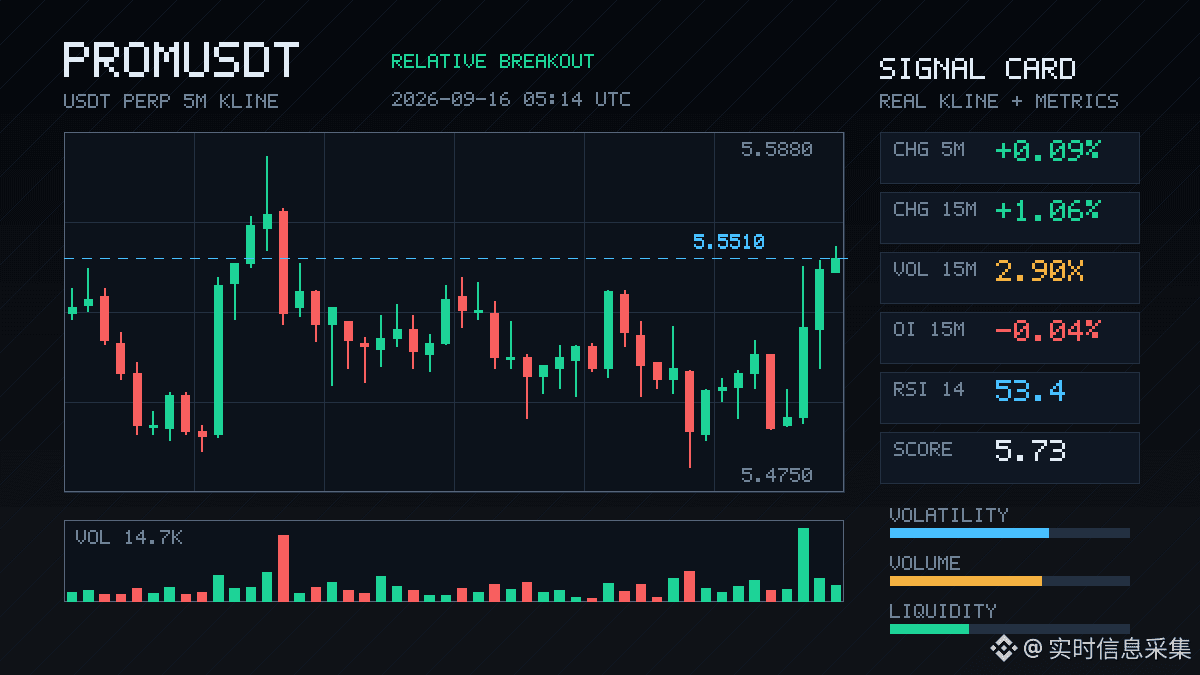
On the 15m chart, it rises straight up by 1.06%. Volume reaches 2.90x, volatility is 2.64, and the closing price has actually broken through the upper boundary of the recent 20 5m intervals. The aggressive buy-sell difference is 26.2%, the buy/sell ratio is 1.71, and the funding rate has also climbed to the recent high percentile—market sentiment is clearly skewed bullish.
But what I care more about is OI.
On the 15m contract, OI is -0.04%, and on the 1h contract, OI is -0.03%. Price is going up, but open interest is actually dropping. This structure looks more like short covering or passive position unwinding, not like new long positions are being aggressively added. OI percentile is 92.1%; within the whole pool, anomaly #9 and notional change #37. It persists across multiple consecutive periods—this suggests it’s not a one-off move, but funds are continuing to take action.
In the last 24h, trading volume is 9.55M. The pool isn’t that big. At this level, a notional change of 166K is enough to push the anomaly into the top ten of the whole pool, and the depth confirmation passed too—trading volume is higher than usual, it reached boundary levels, and there’s directional bias.
My take: the short-term structure is relatively strong, but the “fuel” for the rise is short covering rather than an influx of incremental longs. How sustainable this move is depends on whether OI can keep up afterward. If price keeps climbing while OI continues to drop, then it’s basically forced short behavior—be careful when chasing highs.
On the 15m chart, it rises straight up by 1.06%. Volume reaches 2.90x, volatility is 2.64, and the closing price has actually broken through the upper boundary of the recent 20 5m intervals. The aggressive buy-sell difference is 26.2%, the buy/sell ratio is 1.71, and the funding rate has also climbed to the recent high percentile—market sentiment is clearly skewed bullish.
But what I care more about is OI.
On the 15m contract, OI is -0.04%, and on the 1h contract, OI is -0.03%. Price is going up, but open interest is actually dropping. This structure looks more like short covering or passive position unwinding, not like new long positions are being aggressively added. OI percentile is 92.1%; within the whole pool, anomaly #9 and notional change #37. It persists across multiple consecutive periods—this suggests it’s not a one-off move, but funds are continuing to take action.
In the last 24h, trading volume is 9.55M. The pool isn’t that big. At this level, a notional change of 166K is enough to push the anomaly into the top ten of the whole pool, and the depth confirmation passed too—trading volume is higher than usual, it reached boundary levels, and there’s directional bias.
My take: the short-term structure is relatively strong, but the “fuel” for the rise is short covering rather than an influx of incremental longs. How sustainable this move is depends on whether OI can keep up afterward. If price keeps climbing while OI continues to drop, then it’s basically forced short behavior—be careful when chasing highs.