📉 ETHEREUM TESTS A CRITICAL SUPPORT LEVEL: TECHNICAL BOUNCE OR BEARISH BREAKDOWN? ⚡
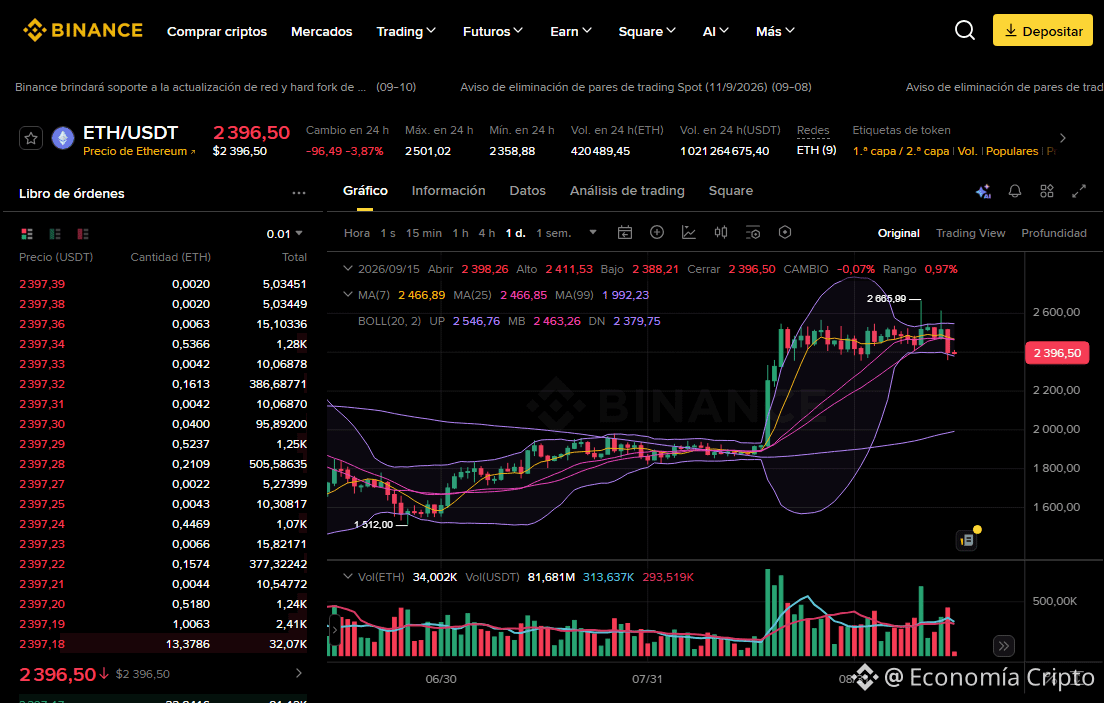
The ETH/USDT pair is trading at 2,396.50, recording a correction of -3.87% over the last 24 hours. The current daily session shows a trading range with a maximum of 2,501.02 and a minimum near 2,358.88, placing the price in a zone of high technical tension.
🔍 Trend Analysis and Indicators
Trend: Short-term bearish correction seeking confirmation at key levels.
Moving Averages: Price is trading below the MA(7) (2,466.89) and below the MA(25) (2,466.85), which show a clear convergence. However, the broader macro structure remains supported, as price is trading well above the MA(99) (1,992.23).
Bollinger Bands: Price breaks through and presses the lower band area DN: 2,379.75 (with the mid band at MB: 2,463.26 and the upper band at UP: 2,546.76), suggesting a temporary oversold scenario and a critical point where demand must appear.
Key Levels: The base structural support is solidly located at 1,512.00, while the main resistance to reclaim is at 2,665.99.
💡 Trading Strategy: Buy or Sell?
Buy (Long)?: The test of the lower Bollinger Band and the proximity to key supports open the door to tactical bounce opportunities for risk-managed profiles, requiring strict risk management and a Stop Loss adjusted below the session low.
Sell (Short)?: A breakdown with solid volume below the lower band could extend the bearish leg, although trading lower at relevant supports requires extreme caution.
#Ethereum #AnalisisTecnico #CryptoTrading
May the Lord bless and prosper those who operate here, in the name of Jesus, because your word says: "Mine is the silver, and mine is the gold," says the LORD of hosts. Hageo 2:8 RV1960-T -
$ETH
The ETH/USDT pair is trading at 2,396.50, recording a correction of -3.87% over the last 24 hours. The current daily session shows a trading range with a maximum of 2,501.02 and a minimum near 2,358.88, placing the price in a zone of high technical tension.
🔍 Trend Analysis and Indicators
Trend: Short-term bearish correction seeking confirmation at key levels.
Moving Averages: Price is trading below the MA(7) (2,466.89) and below the MA(25) (2,466.85), which show a clear convergence. However, the broader macro structure remains supported, as price is trading well above the MA(99) (1,992.23).
Bollinger Bands: Price breaks through and presses the lower band area DN: 2,379.75 (with the mid band at MB: 2,463.26 and the upper band at UP: 2,546.76), suggesting a temporary oversold scenario and a critical point where demand must appear.
Key Levels: The base structural support is solidly located at 1,512.00, while the main resistance to reclaim is at 2,665.99.
💡 Trading Strategy: Buy or Sell?
Buy (Long)?: The test of the lower Bollinger Band and the proximity to key supports open the door to tactical bounce opportunities for risk-managed profiles, requiring strict risk management and a Stop Loss adjusted below the session low.
Sell (Short)?: A breakdown with solid volume below the lower band could extend the bearish leg, although trading lower at relevant supports requires extreme caution.
#Ethereum #AnalisisTecnico #CryptoTrading
May the Lord bless and prosper those who operate here, in the name of Jesus, because your word says: "Mine is the silver, and mine is the gold," says the LORD of hosts. Hageo 2:8 RV1960-T -
$ETH