Bitcoin is getting interesting here.
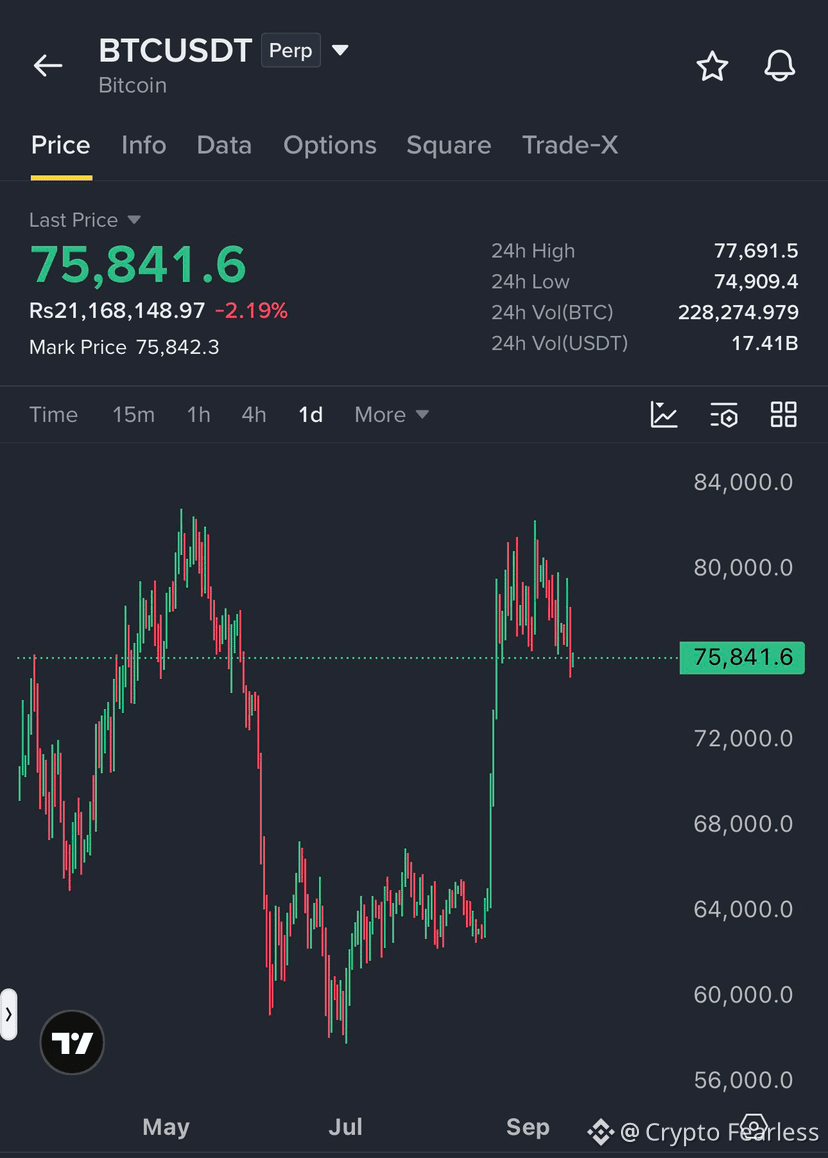
Looking at the daily chart, $BTC is sitting around $75.8K after another rejection from the $80K–$82K area.
What stands out to me is the structure.
BTC had a strong move from around $64K toward $80K, but since reaching that zone, price has failed several times to hold above $80K. Instead, we are seeing lower highs and increasing selling pressure near the top.
Right now, $76K is an important area to watch.
If BTC loses this zone with strong selling, the next areas I would watch are around $72K and then $68K–$70K.
On the other side, if buyers step in and BTC reclaims $78K–$80K with strength, the chart could start looking much stronger again.
For me, the key is simple:
$80K = major resistance
$76K = current decision area
$72K = important downside level
$68K–$70K = deeper support zone
I am not chasing candles here. I want confirmation.
The market has already shown that a quick pump can be followed by an equally quick rejection. The next move will tell us whether this is just another pullback or the beginning of a deeper correction.
Watch the levels, manage risk, and let BTC show the direction first.
Looking at the daily chart, $BTC is sitting around $75.8K after another rejection from the $80K–$82K area.
What stands out to me is the structure.
BTC had a strong move from around $64K toward $80K, but since reaching that zone, price has failed several times to hold above $80K. Instead, we are seeing lower highs and increasing selling pressure near the top.
Right now, $76K is an important area to watch.
If BTC loses this zone with strong selling, the next areas I would watch are around $72K and then $68K–$70K.
On the other side, if buyers step in and BTC reclaims $78K–$80K with strength, the chart could start looking much stronger again.
For me, the key is simple:
$80K = major resistance
$76K = current decision area
$72K = important downside level
$68K–$70K = deeper support zone
I am not chasing candles here. I want confirmation.
The market has already shown that a quick pump can be followed by an equally quick rejection. The next move will tell us whether this is just another pullback or the beginning of a deeper correction.
Watch the levels, manage risk, and let BTC show the direction first.