📉 Bitcoin Tests a Critical Zone: Technical Bounce or Bearish Extension? ⚡
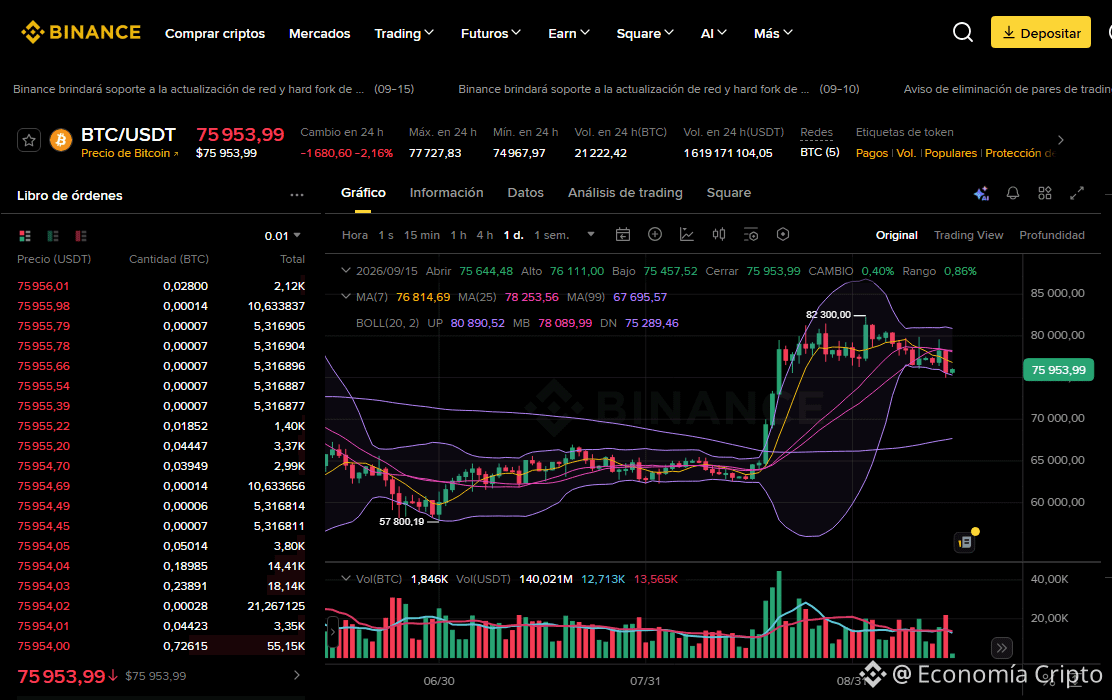
The BTC/USDT pair trades at 75,953.99, recording a -2.16% correction over the last 24 hours, with a daily range that reached a high of 77,727.83 and a low of 74,967.97. Near-term selling pressure is bringing the price close to decisive technical levels.
🔍 Trend Analysis and Indicators
Trend: Correction / short-term consolidation.
Moving Averages: The price is below the fast MA(7) (76,814.69) and the MA(25) (78,253.56), reflecting the recent pullback, although the broader macro structure remains supported by staying firmly above the MA(99) (67,695.57).
Bollinger Bands: The price has fallen from the midline (MB: 78,089.99) and is holding very close to the lower band (DN: 75,289.46; with the upper band at UP: 80,890.52), signaling a high-volatility level where buyers must show up to halt the decline.
Key Levels: The underlying structural support is solidly at 57,800.19, while the immediate resistance to reclaim is at 82,300.00.
💡 Trading Strategy: Buy or Sell?
Buy (Long)?: Approaching the lower Bollinger band and current support opens the door to possible technical rebounds for tactical profiles, requiring strict risk management and a well-defined Stop Loss below the recent lows.
Sell (Short)?: A clear breakdown with volume below the lower band could accelerate the short-term bearish leg, always trading cautiously relative to the macro trend.
#Bitcoin #BTC #AnalisisTecnico #CryptoTrading
The Lord blesses and prospers the one who operates here, in the name of Jesus, because your word says: "Mine is the silver, and mine is the gold," says the LORD of hosts. Hageo 2:8 RV1960-T -
$BTC
The BTC/USDT pair trades at 75,953.99, recording a -2.16% correction over the last 24 hours, with a daily range that reached a high of 77,727.83 and a low of 74,967.97. Near-term selling pressure is bringing the price close to decisive technical levels.
🔍 Trend Analysis and Indicators
Trend: Correction / short-term consolidation.
Moving Averages: The price is below the fast MA(7) (76,814.69) and the MA(25) (78,253.56), reflecting the recent pullback, although the broader macro structure remains supported by staying firmly above the MA(99) (67,695.57).
Bollinger Bands: The price has fallen from the midline (MB: 78,089.99) and is holding very close to the lower band (DN: 75,289.46; with the upper band at UP: 80,890.52), signaling a high-volatility level where buyers must show up to halt the decline.
Key Levels: The underlying structural support is solidly at 57,800.19, while the immediate resistance to reclaim is at 82,300.00.
💡 Trading Strategy: Buy or Sell?
Buy (Long)?: Approaching the lower Bollinger band and current support opens the door to possible technical rebounds for tactical profiles, requiring strict risk management and a well-defined Stop Loss below the recent lows.
Sell (Short)?: A clear breakdown with volume below the lower band could accelerate the short-term bearish leg, always trading cautiously relative to the macro trend.
#Bitcoin #BTC #AnalisisTecnico #CryptoTrading
The Lord blesses and prospers the one who operates here, in the name of Jesus, because your word says: "Mine is the silver, and mine is the gold," says the LORD of hosts. Hageo 2:8 RV1960-T -
$BTC