【See Gainers】
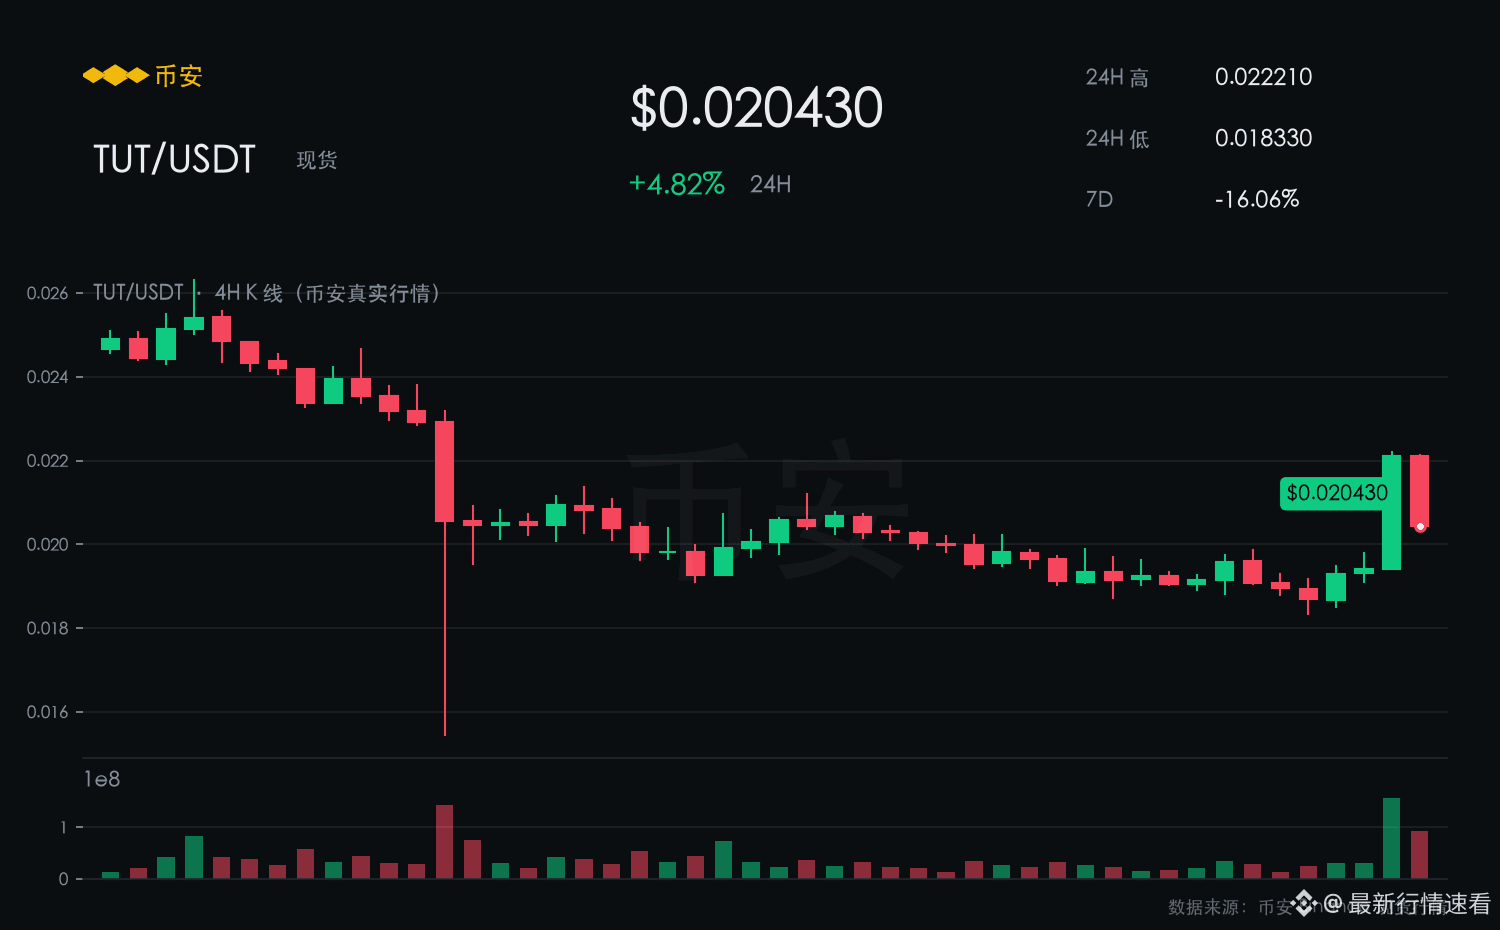
TUT is currently reported at 0.0204; it’s up 4.82% over the past 24 hours. Over the last 7 days, it’s still down 16.06%. The intraday range is 0.0183–0.0222, with a swing amplitude of 21.2%.
【Market Snapshot】
The red candles over the past 24 hours have held close to 0.0204, and short-term buy orders have been relatively proactive.
As long as 0.0183 is not lost, the current pullback can be considered a strong consolidation.
Compared with BTC’s -2.80%, TUT’s relative strength is leading. These kinds of assets often act as pioneers for rebounds.
Near term, the bias is bullish.
【Bullish Rationale】
With the 7-day performance still down 16.06%, a single-day gain of 4.82% should be treated first as an oversold rebound—don’t rush to conclude it’s a full reversal.
In the 24-hour rise of 4.82%, the intraday high of 0.0222 has been tested repeatedly, suggesting that overhead resistance is being digested.
The risk is that after the short-term rally, profit-taking could appear at any time; chasing higher increases the chance of getting “spiked” by a wick.
First, watch for a rebound toward the intraday high of 0.0222. If there’s an effective breakout, it could open up new room; if 0.0183 fails, then shift to a wait-and-see stance.
$TUT #TUT
TUT is currently reported at 0.0204; it’s up 4.82% over the past 24 hours. Over the last 7 days, it’s still down 16.06%. The intraday range is 0.0183–0.0222, with a swing amplitude of 21.2%.
【Market Snapshot】
The red candles over the past 24 hours have held close to 0.0204, and short-term buy orders have been relatively proactive.
As long as 0.0183 is not lost, the current pullback can be considered a strong consolidation.
Compared with BTC’s -2.80%, TUT’s relative strength is leading. These kinds of assets often act as pioneers for rebounds.
Near term, the bias is bullish.
【Bullish Rationale】
With the 7-day performance still down 16.06%, a single-day gain of 4.82% should be treated first as an oversold rebound—don’t rush to conclude it’s a full reversal.
In the 24-hour rise of 4.82%, the intraday high of 0.0222 has been tested repeatedly, suggesting that overhead resistance is being digested.
The risk is that after the short-term rally, profit-taking could appear at any time; chasing higher increases the chance of getting “spiked” by a wick.
First, watch for a rebound toward the intraday high of 0.0222. If there’s an effective breakout, it could open up new room; if 0.0183 fails, then shift to a wait-and-see stance.
$TUT #TUT