9.16BTC
Today’s BTC chart analysis
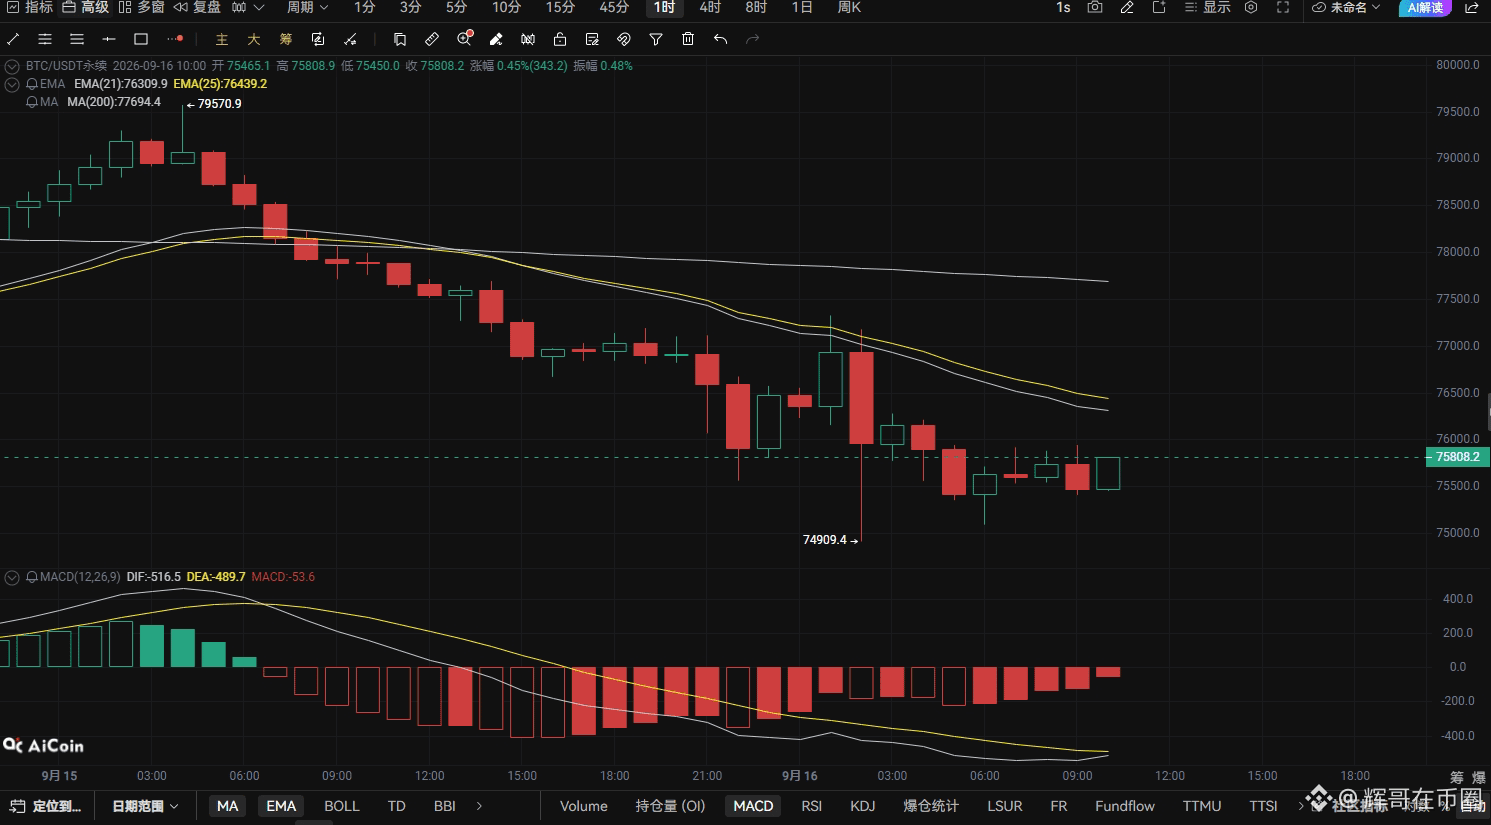
From the structure of the move, this round of decline that began from the 79,570 high has been very decisive. It’s been a series of consecutive bearish candles, with almost no meaningful rebound in between. The slope of the drop is steep, and the short-selling force has been released thoroughly.
After hitting 74,909, it printed a long lower wick. It looks like there’s support at lower levels, but in essence this is indicator correction and the digestion of panic selling after an excessively fast sell-off. Fundamentally, this is a continuation of the downtrend—not a bottom signal.
Key levels
First resistance 760-762
Second resistance 770-772
Trading suggestions
For short-term trading, you can wait for rejection in the 762-763 range and consider shorting. The first target to watch is around 75,000.
Before the FOMC decision is released, keep position size within half capacity.
$BTC #比特币跌至7.6万美元
Today’s BTC chart analysis
From the structure of the move, this round of decline that began from the 79,570 high has been very decisive. It’s been a series of consecutive bearish candles, with almost no meaningful rebound in between. The slope of the drop is steep, and the short-selling force has been released thoroughly.
After hitting 74,909, it printed a long lower wick. It looks like there’s support at lower levels, but in essence this is indicator correction and the digestion of panic selling after an excessively fast sell-off. Fundamentally, this is a continuation of the downtrend—not a bottom signal.
Key levels
First resistance 760-762
Second resistance 770-772
Trading suggestions
For short-term trading, you can wait for rejection in the 762-763 range and consider shorting. The first target to watch is around 75,000.
Before the FOMC decision is released, keep position size within half capacity.
$BTC #比特币跌至7.6万美元