$ON Part 1: Price Trend and Recent Performance
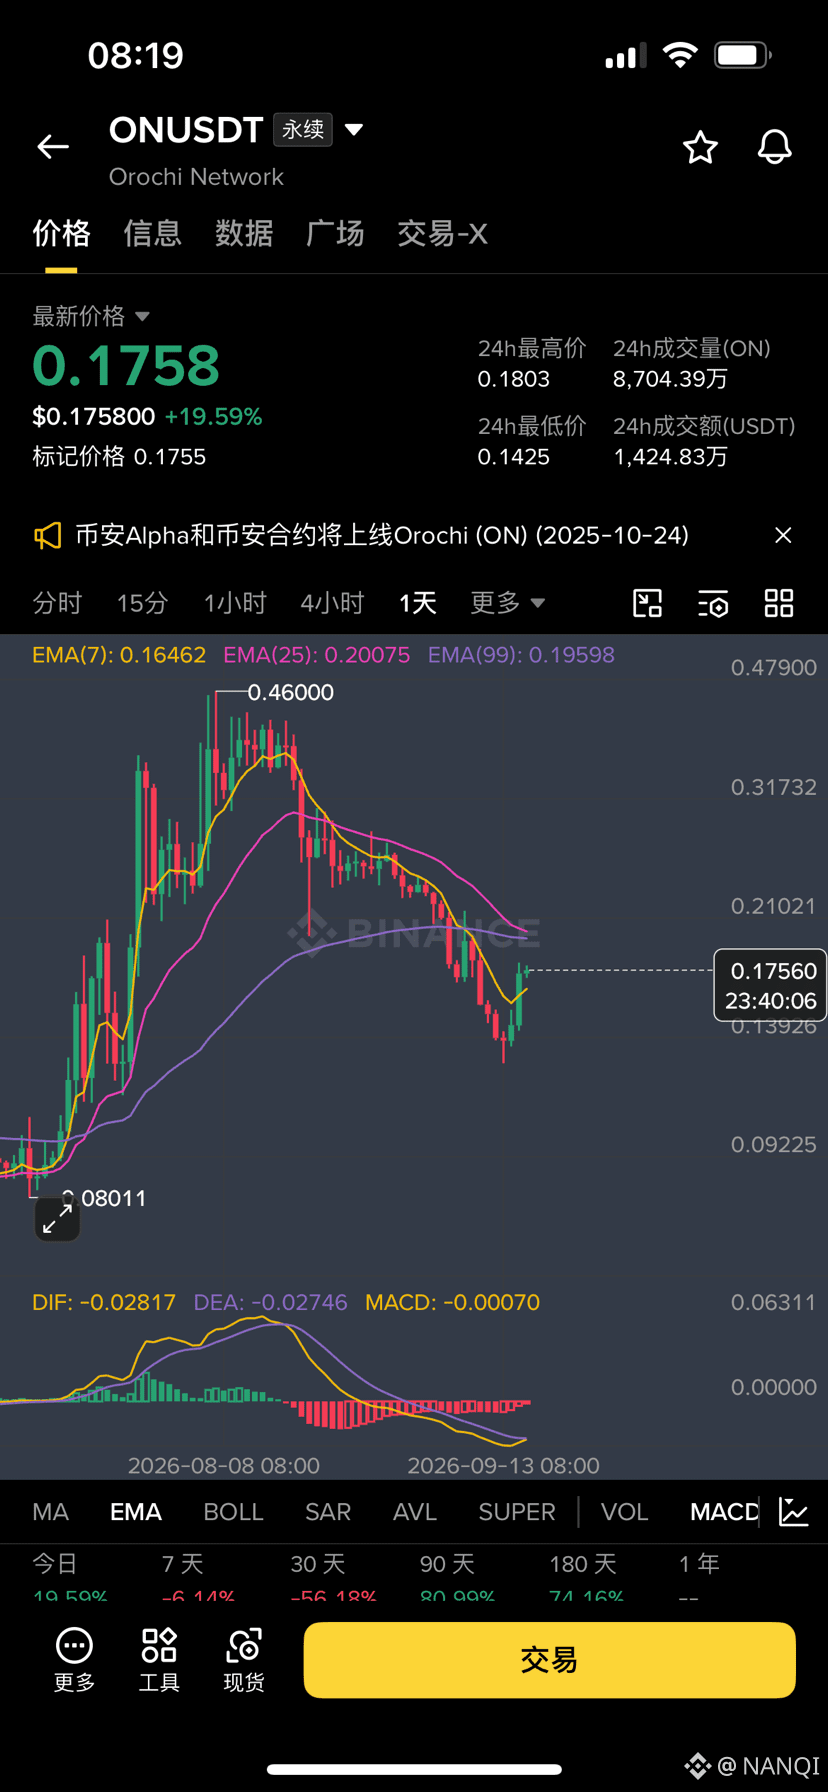
Current Price: The latest price is 0.1758 USD, with a day’s gain of +19.59%, indicating that buy-side strength is relatively strong in the short term.
Trading Range Fluctuations: Within the past 24 hours, the highest price reached 0.1803 USD, while the lowest dipped to 0.1425 USD—showing a significant level of volatility.
Historical Highs and Lows: Judging from the overall daily K-line pattern, the historical low previously touched 0.0801 USD. After a sharp surge, the price later peaked at 0.4600 USD, and then entered a long period of correction.
Part 2: Technical Indicator Analysis
Moving Average System (EMA):
The short-term EMA(7) is at 0.16462. The current price is already holding above it, suggesting a demand for short-term rebound and repair.
The medium-to-long-term EMA(25) is at 0.20075, and EMA(99) is at 0.19598. Both moving averages remain above the price, forming resistance; overall, the medium-to-long-term trend is still in a repair phase following a bearish adjustment.
MACD Indicator:
Current DIF is -0.02817, DEA is -0.02746, and the MACD histogram value is -0.00070.
Although the fast and slow lines are still below the zero axis, the green bars are shortening and approaching the zero axis, implying that bearish momentum may be weakening. There is a possibility that the market is forming a bottom.
Current Price: The latest price is 0.1758 USD, with a day’s gain of +19.59%, indicating that buy-side strength is relatively strong in the short term.
Trading Range Fluctuations: Within the past 24 hours, the highest price reached 0.1803 USD, while the lowest dipped to 0.1425 USD—showing a significant level of volatility.
Historical Highs and Lows: Judging from the overall daily K-line pattern, the historical low previously touched 0.0801 USD. After a sharp surge, the price later peaked at 0.4600 USD, and then entered a long period of correction.
Part 2: Technical Indicator Analysis
Moving Average System (EMA):
The short-term EMA(7) is at 0.16462. The current price is already holding above it, suggesting a demand for short-term rebound and repair.
The medium-to-long-term EMA(25) is at 0.20075, and EMA(99) is at 0.19598. Both moving averages remain above the price, forming resistance; overall, the medium-to-long-term trend is still in a repair phase following a bearish adjustment.
MACD Indicator:
Current DIF is -0.02817, DEA is -0.02746, and the MACD histogram value is -0.00070.
Although the fast and slow lines are still below the zero axis, the green bars are shortening and approaching the zero axis, implying that bearish momentum may be weakening. There is a possibility that the market is forming a bottom.