$ARB Analysis: Bullish Momentum Gains Strength on the 4H Timeframe 📈
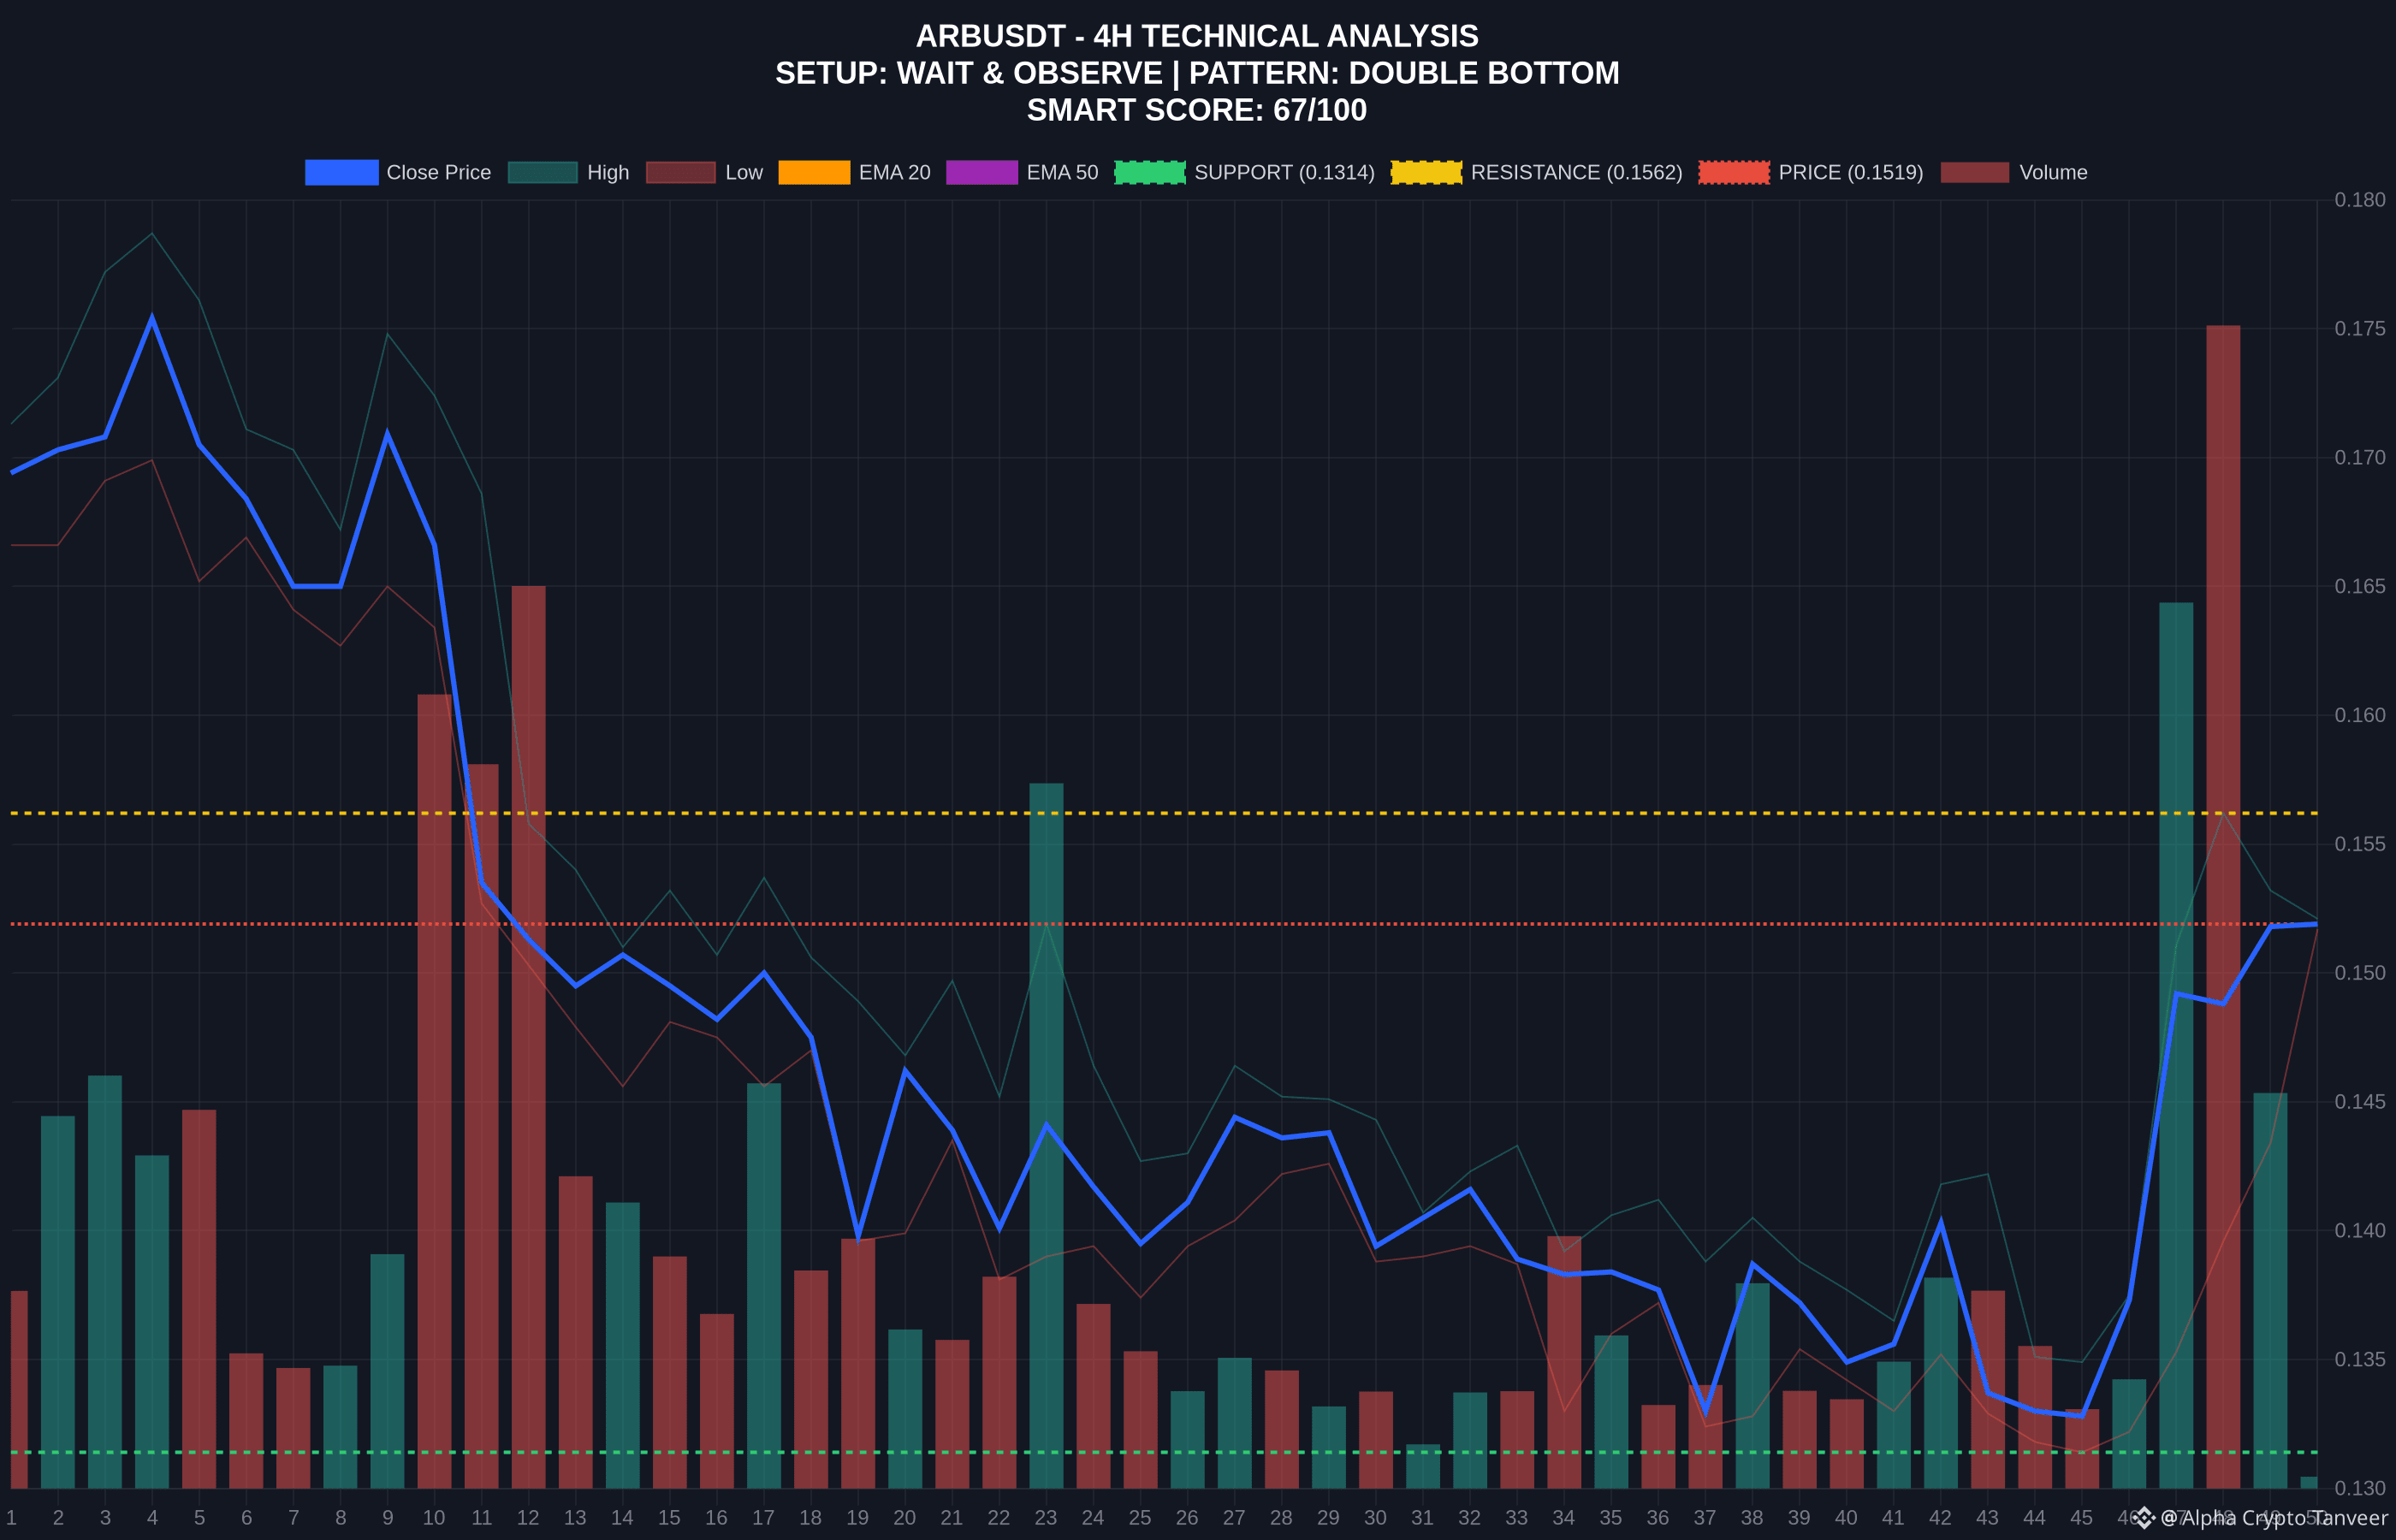
The price of $ARB is currently showing strong upward movement, recording a notable 14.21% increase over the last 24 hours. Looking at the technical data on the 4H timeframe, the market structure suggests a bullish bias.
Technical Indicators Breakdown:
Moving Averages: The EMA20 (0.14239) has recently moved above the EMA50 (0.14234). This bullish crossover indicates that the short-term trend is gaining strength relative to the medium-term average.
MACD: The MACD histogram is currently positive at 0.00247, with the MACD line trending above the signal line. This confirms that buyers are currently in control of the price action.
RSI: The Relative Strength Index is sitting at 61.79. This reflects healthy buying pressure and strong momentum without yet entering the overbought zone, which typically begins above 70.
Key Levels to Watch:
Current Resistance: 0.1562. A clean break above this level could signal further continuation of the current move.
Immediate Support: 0.1314. This level serves as a critical floor should the price undergo a retracement.
While the current indicators point toward a bullish outlook, traders should always remain cautious and monitor for any shifts in volume or market sentiment.
⚠️ Technical analysis only. Not financial advice.
#ARB #Arbitrum #CryptoAnalysis #TechnicalAnalysis #BinanceSquareOfficial
The price of $ARB is currently showing strong upward movement, recording a notable 14.21% increase over the last 24 hours. Looking at the technical data on the 4H timeframe, the market structure suggests a bullish bias.
Technical Indicators Breakdown:
Moving Averages: The EMA20 (0.14239) has recently moved above the EMA50 (0.14234). This bullish crossover indicates that the short-term trend is gaining strength relative to the medium-term average.
MACD: The MACD histogram is currently positive at 0.00247, with the MACD line trending above the signal line. This confirms that buyers are currently in control of the price action.
RSI: The Relative Strength Index is sitting at 61.79. This reflects healthy buying pressure and strong momentum without yet entering the overbought zone, which typically begins above 70.
Key Levels to Watch:
Current Resistance: 0.1562. A clean break above this level could signal further continuation of the current move.
Immediate Support: 0.1314. This level serves as a critical floor should the price undergo a retracement.
While the current indicators point toward a bullish outlook, traders should always remain cautious and monitor for any shifts in volume or market sentiment.
⚠️ Technical analysis only. Not financial advice.
#ARB #Arbitrum #CryptoAnalysis #TechnicalAnalysis #BinanceSquareOfficial