$SYN 🚀 SYNUSDT short-term surge up over 17%! Is this strong breakout a distribution event or the start of a new rally? 🔥
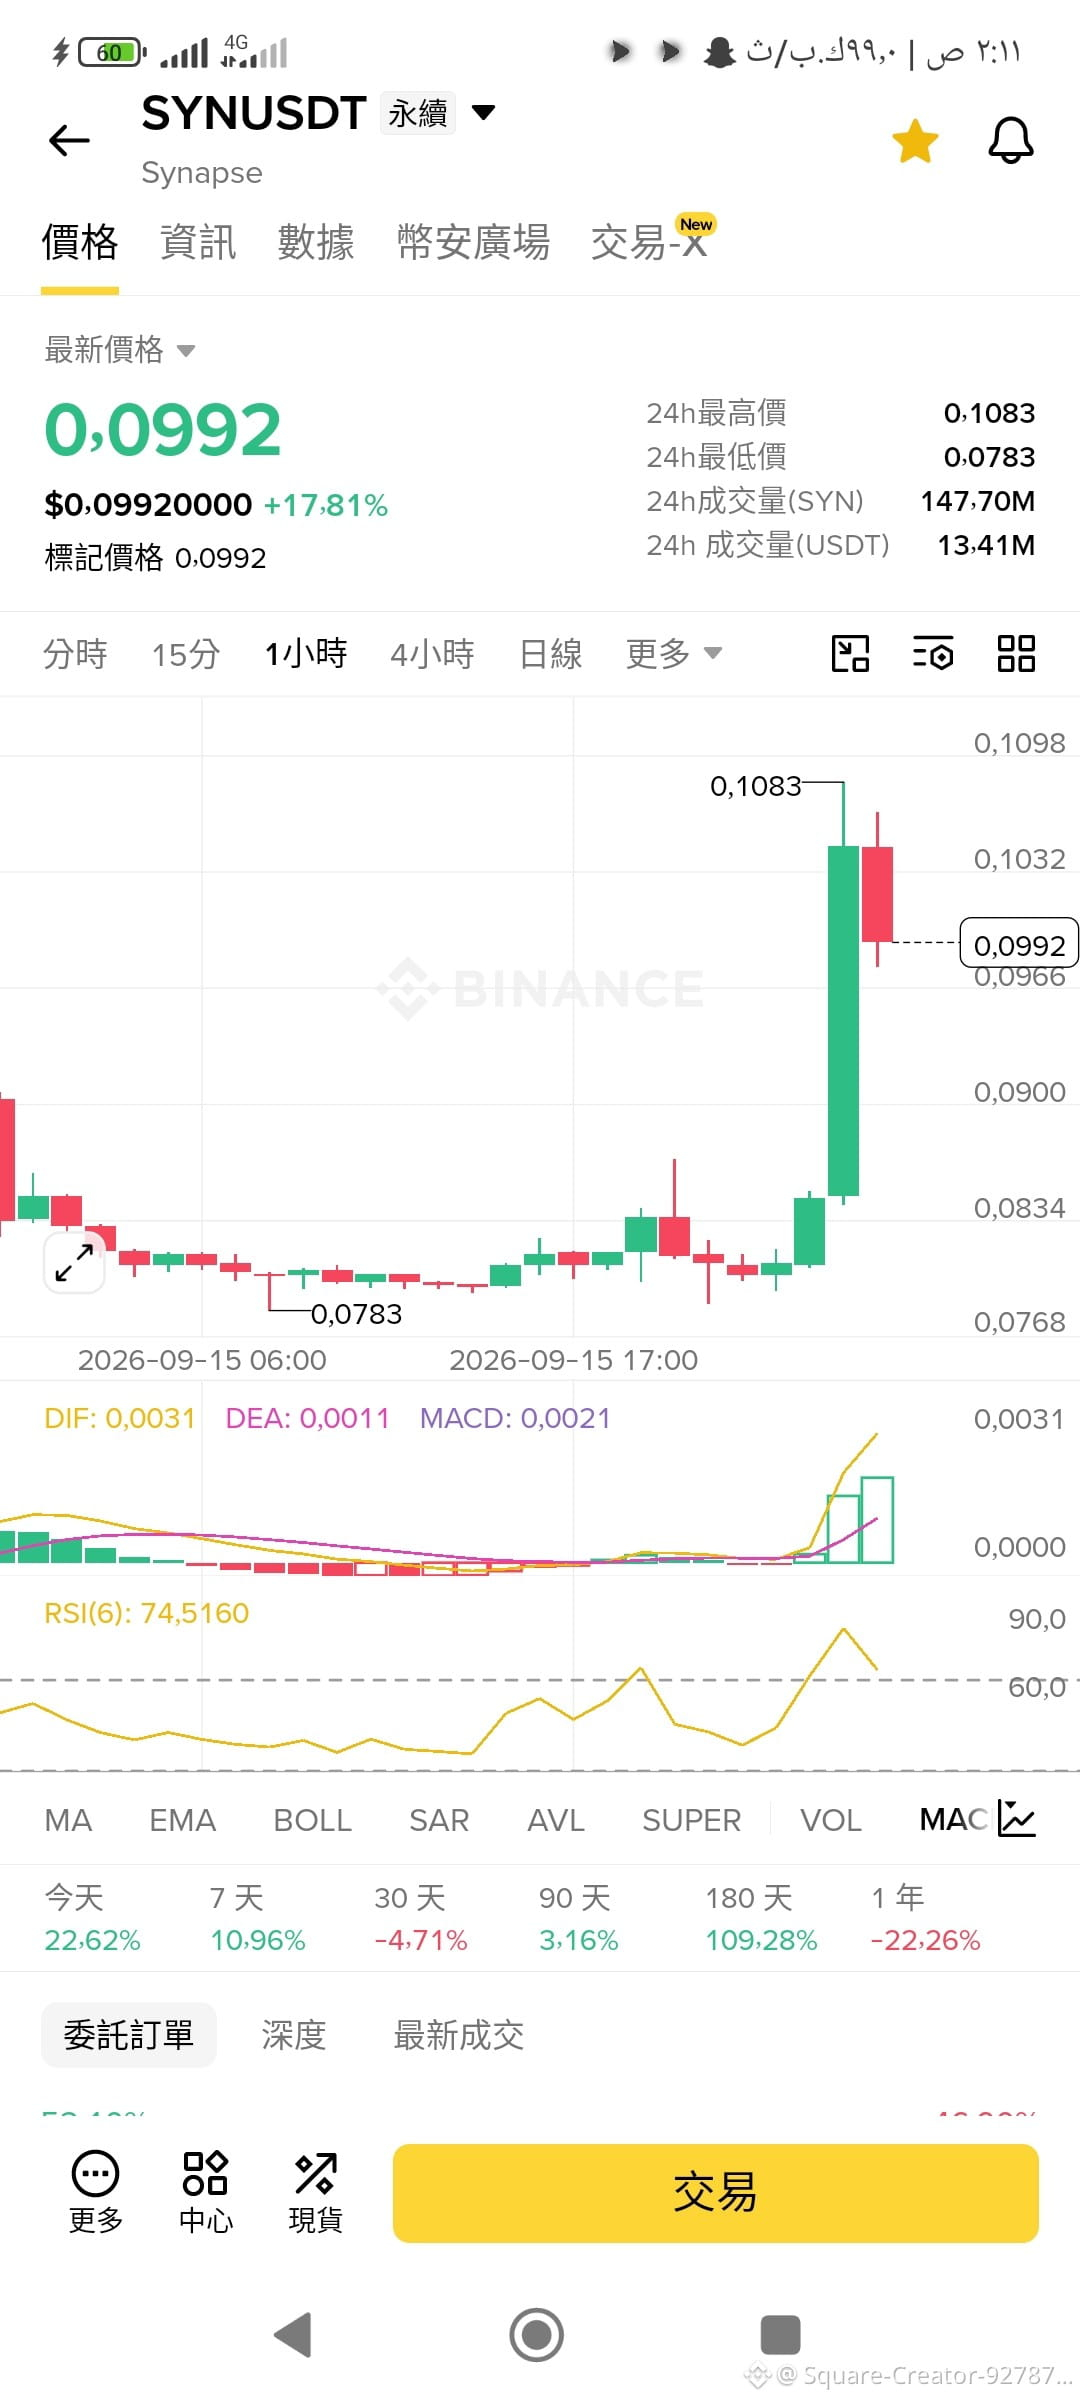
From the 1-hour K-line chart, after SYN/USDT formed a bottom around 0.0783, a sudden burst of aggressive buying sent it rocketing all the way up to a high of 0.1083! Although it has pulled back somewhat to 0.0992 currently, the bullish momentum is still extremely strong!📈
📊 Technical highlights analysis:
1️⃣ Massive expansion in trading volume: The 24-hour trading volume has reached as high as 14.41 million USDT (147 million SYN), clearly showing signs that major funds have moved in!
2️⃣ MACD bull cross with expanding volume: DIF and DEA have risen strongly; the green MACD histogram bars have rapidly expanded, indicating bulls are dominating the market.
3️⃣ RSI indicator retracement: RSI(6) is currently 74.51. It has slightly pulled back from overbought levels, giving the market breathing room and space for rotation.
$BTC
#美联储加息是否已成定局
From the 1-hour K-line chart, after SYN/USDT formed a bottom around 0.0783, a sudden burst of aggressive buying sent it rocketing all the way up to a high of 0.1083! Although it has pulled back somewhat to 0.0992 currently, the bullish momentum is still extremely strong!📈
📊 Technical highlights analysis:
1️⃣ Massive expansion in trading volume: The 24-hour trading volume has reached as high as 14.41 million USDT (147 million SYN), clearly showing signs that major funds have moved in!
2️⃣ MACD bull cross with expanding volume: DIF and DEA have risen strongly; the green MACD histogram bars have rapidly expanded, indicating bulls are dominating the market.
3️⃣ RSI indicator retracement: RSI(6) is currently 74.51. It has slightly pulled back from overbought levels, giving the market breathing room and space for rotation.
$BTC
#美联储加息是否已成定局