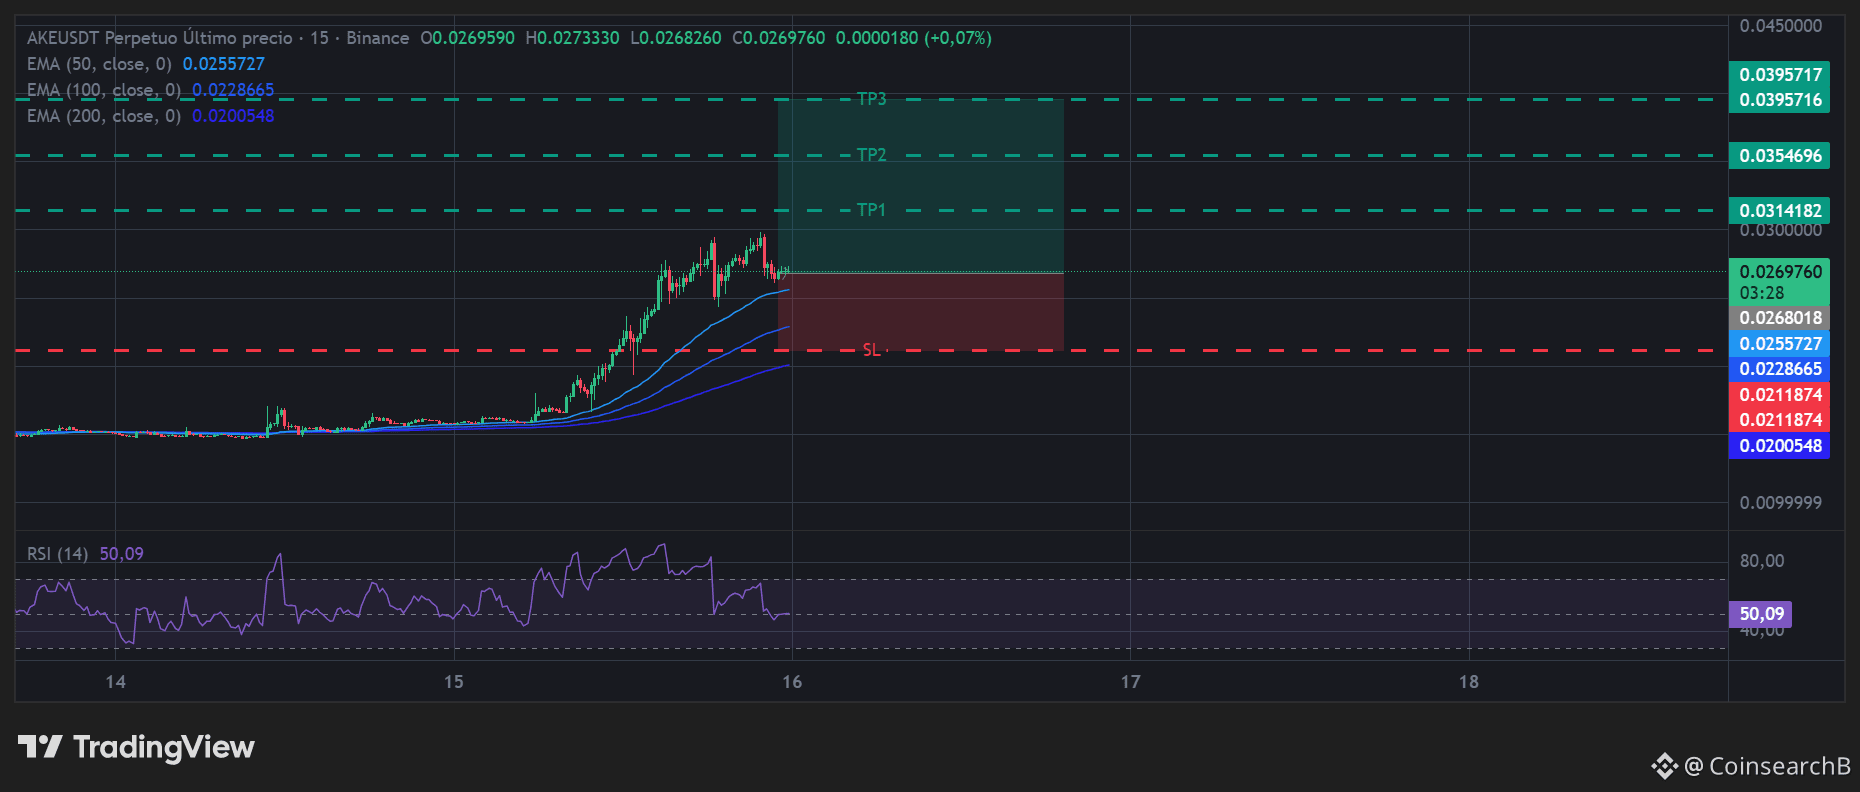
When an asset rises violently and doesn’t pull back, it’s shouting strength at you. $AKE had an aggressive rally and, instead of making a deep correction, it’s ranging sideways and absorbing all the sell pressure at the top. This consolidation is a local accumulation from the playbook; the order flow remains on the buy side, and we position ourselves to ride along with the next push.
$AKE - 🟢 LONG - Conf 85%
Trading Plan:
Entry: 0.02680 – 0.02720
SL: 0.02557
TP1: 0.03141
TP2: 0.03546
TP3: 0.03957
Technical logic behind the trade:
Order Flow Intact: If we look at the 15m chart, the institutional footprint is crystal clear. After the parabolic expansion, price formed a narrow range at the highs. There’s no intention to mark lower lows, which shows that strong hands are defending the zone and accumulating before continuing the climb.
Time Correction (RSI): Pay attention to the RSI detail—it landed perfectly at 50.64. The indicator reset to the neutral zone without the price suffering a deep structural pullback (pullback). The market has already digested the overbought move and has room to expand upward again.
Dynamic Confluence: The 50-period EMA (0.0255) is rising quickly to catch up to price, acting as our main structural support. The momentum of the three moving averages aligns in our favor.
Surgical Invalidation: We anchor the Stop Loss (0.02557) strategically at the exact level of the 50 EMA. If price breaks that level, the immediate continuation setup is invalidated. The risk ratio is minimal compared to the projection of going to sweep the buy-side liquidity resting up to the 0.039 area.
With consolidations this tight near the highs, do you trigger straight into the market inside the range assuming there won’t be a pullback, or do you prefer to wait for a prior liquidity sweep (sweep) to the downside before buying?
Leave your read in the comments! 👇
Click here to trade 👇
$AKE - 🟢 LONG - Conf 85%
Trading Plan:
Entry: 0.02680 – 0.02720
SL: 0.02557
TP1: 0.03141
TP2: 0.03546
TP3: 0.03957
Technical logic behind the trade:
Order Flow Intact: If we look at the 15m chart, the institutional footprint is crystal clear. After the parabolic expansion, price formed a narrow range at the highs. There’s no intention to mark lower lows, which shows that strong hands are defending the zone and accumulating before continuing the climb.
Time Correction (RSI): Pay attention to the RSI detail—it landed perfectly at 50.64. The indicator reset to the neutral zone without the price suffering a deep structural pullback (pullback). The market has already digested the overbought move and has room to expand upward again.
Dynamic Confluence: The 50-period EMA (0.0255) is rising quickly to catch up to price, acting as our main structural support. The momentum of the three moving averages aligns in our favor.
Surgical Invalidation: We anchor the Stop Loss (0.02557) strategically at the exact level of the 50 EMA. If price breaks that level, the immediate continuation setup is invalidated. The risk ratio is minimal compared to the projection of going to sweep the buy-side liquidity resting up to the 0.039 area.
With consolidations this tight near the highs, do you trigger straight into the market inside the range assuming there won’t be a pullback, or do you prefer to wait for a prior liquidity sweep (sweep) to the downside before buying?
Leave your read in the comments! 👇
Click here to trade 👇