BTC/USDT Analysis (1D) — Heading toward $60,000 after the legislative stop?
The rejection of the CLARITY Bill in the Senate injects uncertainty into the spot market and removes the institutional catalyst in the short term, accelerating profit-taking.
Technical Reading (Daily Chart):
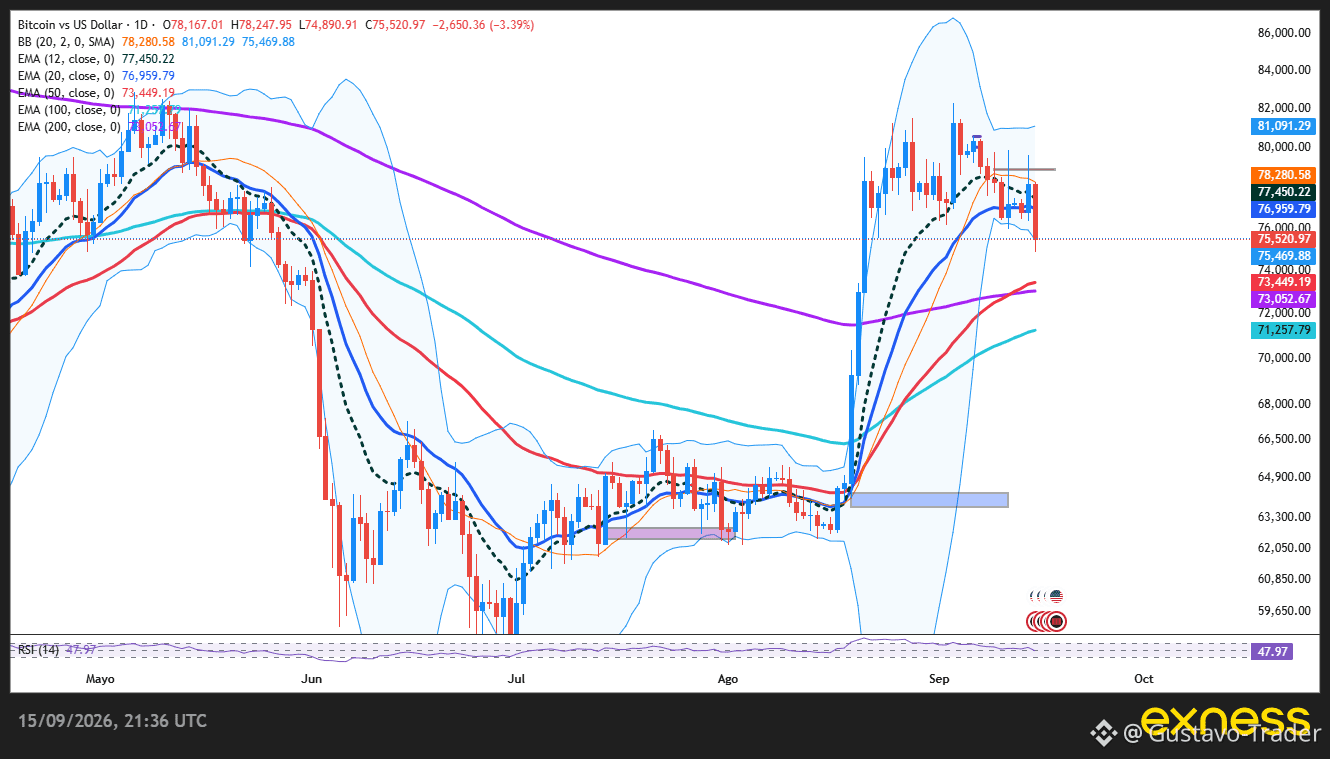
Price Action: Loss of the $81,000 range. Candle close seeking the $75,520 area with steady sell pressure.
EMAs: Loss of the 12 EMA ($77,450) and the 20 EMA ($76,959), which now become immediate resistance. Structural support sits in the 50 EMA ($73,449) and 100 EMA ($73,052) block.
Bollinger & RSI: Break through the mid band ($78,280) pushing toward the lower band ($75,469). The RSI at 47.97 crosses into bearish territory, leaving room for further downside without extreme oversold conditions.
Is it feasible to see $60,000 in the coming weeks?
Base Scenario: First test institutional liquidity between $73,450 and $71,250 (EMA 200). Moving directly to $60,000 within a matter of days is unlikely without explicit macro panic.
Bearish Trigger to $60K: If BTC breaks with a full daily candlestick below the EMA 200 ($71,257), the bullish structure on the 1D timeframe is invalidated. This would enable liquidation toward $64,000 and subsequently a sweep of stops in the psychological $60,000 zone.
Levels to Monitor:
Resistance: $76,950 / $78,280
Key Support: $73,450 / $71,250
Capitulation Zone: $64,000 – $60,000
#Bitcoin #BTC #BinanceSquare #TechnicalAnalysis #CLARITYAct
The rejection of the CLARITY Bill in the Senate injects uncertainty into the spot market and removes the institutional catalyst in the short term, accelerating profit-taking.
Technical Reading (Daily Chart):
Price Action: Loss of the $81,000 range. Candle close seeking the $75,520 area with steady sell pressure.
EMAs: Loss of the 12 EMA ($77,450) and the 20 EMA ($76,959), which now become immediate resistance. Structural support sits in the 50 EMA ($73,449) and 100 EMA ($73,052) block.
Bollinger & RSI: Break through the mid band ($78,280) pushing toward the lower band ($75,469). The RSI at 47.97 crosses into bearish territory, leaving room for further downside without extreme oversold conditions.
Is it feasible to see $60,000 in the coming weeks?
Base Scenario: First test institutional liquidity between $73,450 and $71,250 (EMA 200). Moving directly to $60,000 within a matter of days is unlikely without explicit macro panic.
Bearish Trigger to $60K: If BTC breaks with a full daily candlestick below the EMA 200 ($71,257), the bullish structure on the 1D timeframe is invalidated. This would enable liquidation toward $64,000 and subsequently a sweep of stops in the psychological $60,000 zone.
Levels to Monitor:
Resistance: $76,950 / $78,280
Key Support: $73,450 / $71,250
Capitulation Zone: $64,000 – $60,000
#Bitcoin #BTC #BinanceSquare #TechnicalAnalysis #CLARITYAct