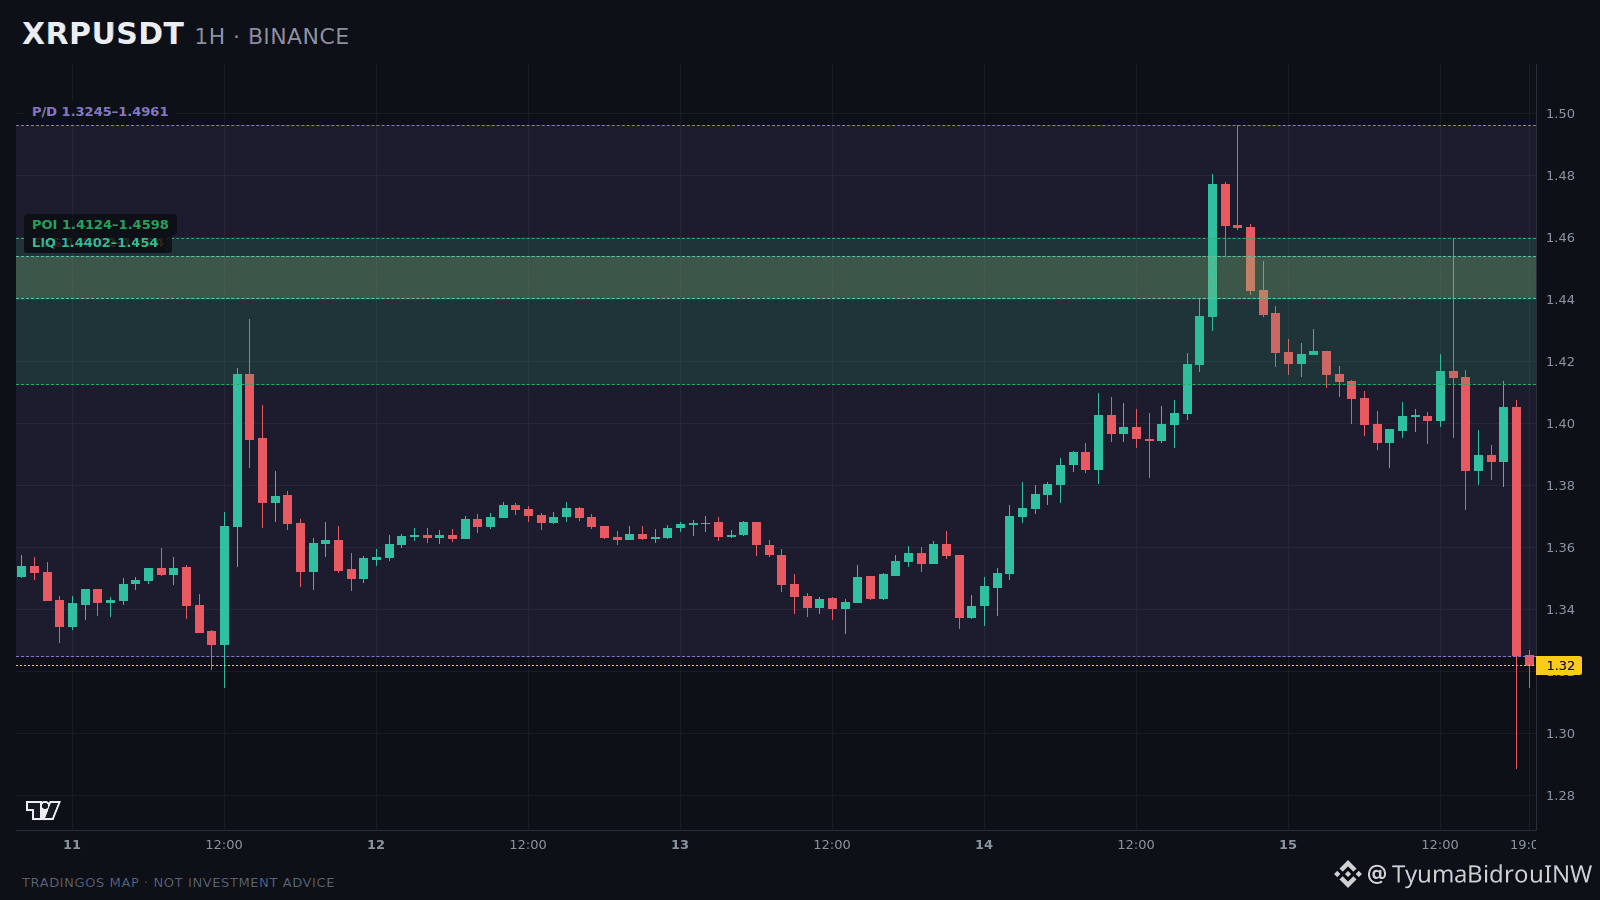
If $XRP shifts today, the countdown will start from the zone above the current price.
Price is around 1.3237, -9.694% per day.
Daily range: 1.2889-1.4961.
What you can see in TradingOS:
— above the current price there is a POI 1.399985-1.4598 — a pressure zone, not support, because the price is currently below it;
— above the current price there is a bearish FVG 1.4377-1.4418 — a pressure zone, not support, because the price is currently below it;
— above the current price there is a bearish FVG 1.4522-1.4628 — a pressure zone, not support, because the price is currently below it;
— above the current price there is a bullish OB zone 1.3844-1.3937 — a pressure zone, not support, because the price is currently below it;
Weights of scenarios based on current data:
long scenario — 9%;
short scenario — 73%.
This is not the probability of a trade, but an assessment of the context.
What matters:
if the price returns above the 1.4522-1.4628 area and holds there, the long context will start to strengthen. If the reaction is again weak, the bearish scenario will remain the main one.
This is a scenario map, not a trading instruction.
$XRP #Crypto #BinanceSquare #Trading
Chart and order book — click on $XRP .
Not an investment recommendation.
Do you agree with the analysis or see it differently? I’m waiting for your take below.
Real-time analyses and a full log — on X: @TyumaBidrouINW
Price is around 1.3237, -9.694% per day.
Daily range: 1.2889-1.4961.
What you can see in TradingOS:
— above the current price there is a POI 1.399985-1.4598 — a pressure zone, not support, because the price is currently below it;
— above the current price there is a bearish FVG 1.4377-1.4418 — a pressure zone, not support, because the price is currently below it;
— above the current price there is a bearish FVG 1.4522-1.4628 — a pressure zone, not support, because the price is currently below it;
— above the current price there is a bullish OB zone 1.3844-1.3937 — a pressure zone, not support, because the price is currently below it;
Weights of scenarios based on current data:
long scenario — 9%;
short scenario — 73%.
This is not the probability of a trade, but an assessment of the context.
What matters:
if the price returns above the 1.4522-1.4628 area and holds there, the long context will start to strengthen. If the reaction is again weak, the bearish scenario will remain the main one.
This is a scenario map, not a trading instruction.
$XRP #Crypto #BinanceSquare #Trading
Chart and order book — click on $XRP .
Not an investment recommendation.
Do you agree with the analysis or see it differently? I’m waiting for your take below.
Real-time analyses and a full log — on X: @TyumaBidrouINW