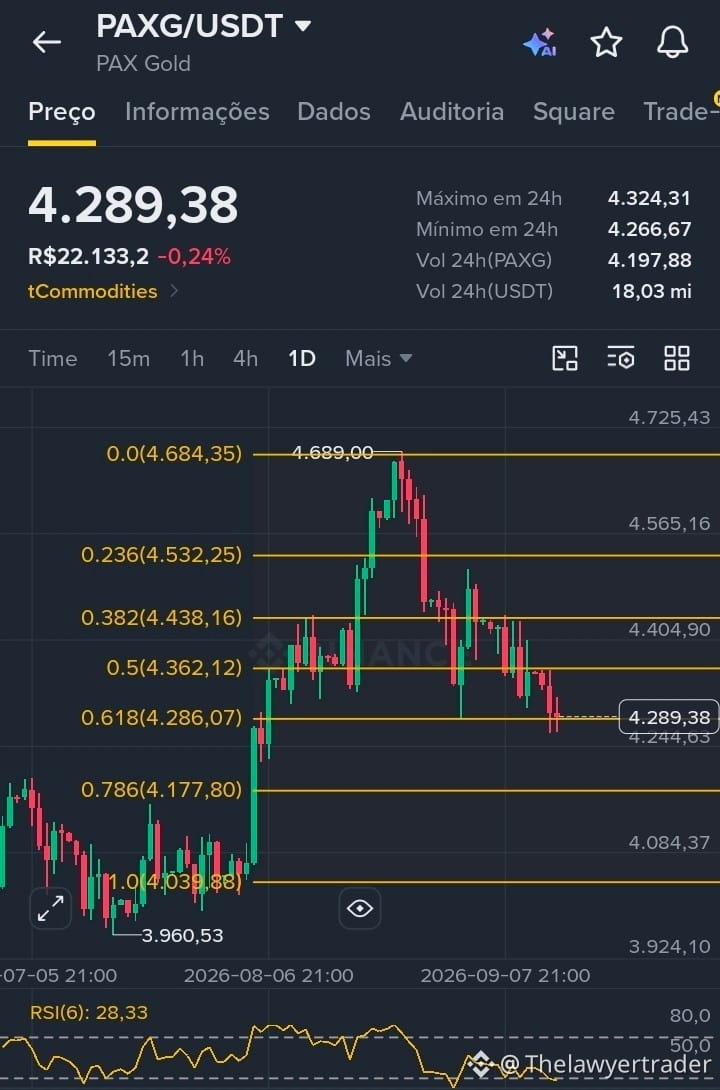
PAXG - Analysis 1D
At this moment, the asset is testing the Fibonacci 0.618 region (4,286.07), a classic zone of interest for trend support. The price is trading around 4,289.38, as buyers try to defend this area.
Immediate support: 4,286.07 (0.618). If broken, the next relevant level is at 4,177.80 (0.786).
Immediate resistance: 4,362.12 (0.5), which previously acted as support/consolidation and now serves as the first technical barrier.
The RSI(6) is at 28.33, a bearish oversold condition. Combined with the 0.618 test, there is a plausible short-term rebound scenario, which may present an entry opportunity.
However, be careful: oversold conditions can persist in strong downtrends, so confirmation (holding the level and a RSI reversal) is what validates the trigger. In addition, we may be looking at an OCO (order cancellation/replace) scenario, even if it looks messy on the chart, which could bring more downside.
Risk management: Regardless of the setup, protect the trade. Use a stop loss below the support zone to limit losses and maintain balance between exposure and cash, avoiding concentrating capital in a single trade.
Oh, this analysis does not constitute investment advice. Trade at your own risk, always with defined risk management.
#PAXGUSDT #analise_grafica $PAXG
At this moment, the asset is testing the Fibonacci 0.618 region (4,286.07), a classic zone of interest for trend support. The price is trading around 4,289.38, as buyers try to defend this area.
Immediate support: 4,286.07 (0.618). If broken, the next relevant level is at 4,177.80 (0.786).
Immediate resistance: 4,362.12 (0.5), which previously acted as support/consolidation and now serves as the first technical barrier.
The RSI(6) is at 28.33, a bearish oversold condition. Combined with the 0.618 test, there is a plausible short-term rebound scenario, which may present an entry opportunity.
However, be careful: oversold conditions can persist in strong downtrends, so confirmation (holding the level and a RSI reversal) is what validates the trigger. In addition, we may be looking at an OCO (order cancellation/replace) scenario, even if it looks messy on the chart, which could bring more downside.
Risk management: Regardless of the setup, protect the trade. Use a stop loss below the support zone to limit losses and maintain balance between exposure and cash, avoiding concentrating capital in a single trade.
Oh, this analysis does not constitute investment advice. Trade at your own risk, always with defined risk management.
#PAXGUSDT #analise_grafica $PAXG