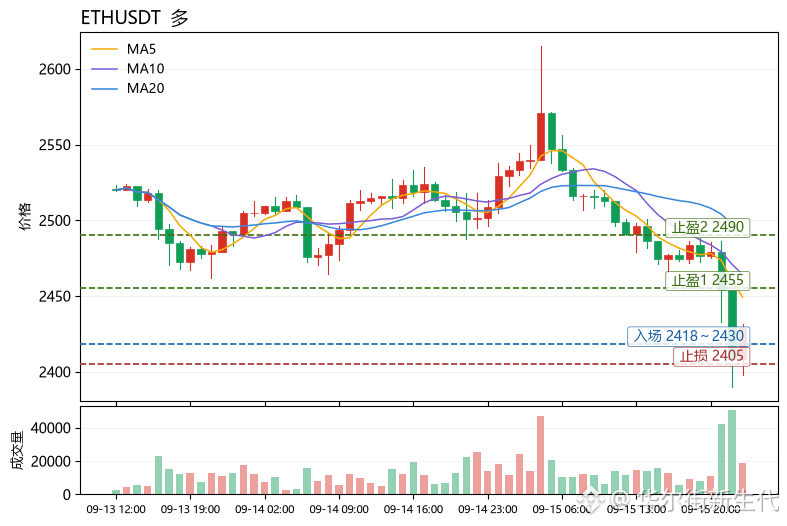
When the moving averages are arranged bearishly and the price breaks below the lower Bollinger Band, should you bottom-fish now or wait for confirmation? My answer is: first assess the health of the trend, then decide whether to “catch the falling knife.” Take $ETH as an example: the current price is 2428.69. MA5=2449.34 has already crossed below MA20=2491.95, which is a typical signal that the short-term trend is weakening. RSI=31.8 is approaching the oversold area, but it is not extremely oversold yet. MACD histogram -7.924 is still negative, indicating bearish momentum has not fully released—downward follow-through may still be possible.
The lower Bollinger Band at 2418.61 is the first support. If the price keeps hugging the lower band, that’s one thing; if it breaks below with increasing volume, it opens up more room to the downside. A reusable way to watch: when MA5 < MA20, the MACD histogram is negative, and RSI is below 35, don’t chase shorts and don’t rush to bottom-fish. Wait for a downside stabilization signal near the lower Bollinger Band (e.g., a long lower wick or a reduction in sell volume), then try a small long position. The funding rate -0.0048% shows bears have a slight edge but not an extreme one. The Fear and Greed index at 69 is still in the greed range, suggesting the market sentiment isn’t panicking; a rebound is possible but still needs confirmation.
Directional view: for the short term, look for a long rebound (go against the trend with a small position). Entry reference zone: 2418~2430 (near the lower Bollinger Band and the current price, betting on an oversold repair). Take-profit 1: 2455 (near MA5 resistance, especially if RSI rises back above 40). Take-profit 2: 2490 (around MA20 and the Bollinger middle band; you can hold if the MACD histogram turns positive). Stop-loss: 2405 (if the price breaks below the lower Bollinger Band with volume, the trend likely continues—exit).
Also watch at the same time: $TUT and $VTHO. Both are clearly stronger than ETH in relative strength. TUT’s RSI is already 81.3, meaning it’s at a high-risk chase level when overbought; VTHO’s trend is healthier and can be observed.
(Personal opinion only, for reference, not investment advice. Contract risk is extremely high—please strictly control your position size.)
【Data】
Coin: ETHUSDT
Direction: Long
Entry: 2418~2430
Take-profit 1: 2455
Take-profit 2: 2490
Stop-loss: 2405
The lower Bollinger Band at 2418.61 is the first support. If the price keeps hugging the lower band, that’s one thing; if it breaks below with increasing volume, it opens up more room to the downside. A reusable way to watch: when MA5 < MA20, the MACD histogram is negative, and RSI is below 35, don’t chase shorts and don’t rush to bottom-fish. Wait for a downside stabilization signal near the lower Bollinger Band (e.g., a long lower wick or a reduction in sell volume), then try a small long position. The funding rate -0.0048% shows bears have a slight edge but not an extreme one. The Fear and Greed index at 69 is still in the greed range, suggesting the market sentiment isn’t panicking; a rebound is possible but still needs confirmation.
Directional view: for the short term, look for a long rebound (go against the trend with a small position). Entry reference zone: 2418~2430 (near the lower Bollinger Band and the current price, betting on an oversold repair). Take-profit 1: 2455 (near MA5 resistance, especially if RSI rises back above 40). Take-profit 2: 2490 (around MA20 and the Bollinger middle band; you can hold if the MACD histogram turns positive). Stop-loss: 2405 (if the price breaks below the lower Bollinger Band with volume, the trend likely continues—exit).
Also watch at the same time: $TUT and $VTHO. Both are clearly stronger than ETH in relative strength. TUT’s RSI is already 81.3, meaning it’s at a high-risk chase level when overbought; VTHO’s trend is healthier and can be observed.
(Personal opinion only, for reference, not investment advice. Contract risk is extremely high—please strictly control your position size.)
【Data】
Coin: ETHUSDT
Direction: Long
Entry: 2418~2430
Take-profit 1: 2455
Take-profit 2: 2490
Stop-loss: 2405