BTC This move isn’t the long side “capitulating and rotating,” it’s the shorts taking over.
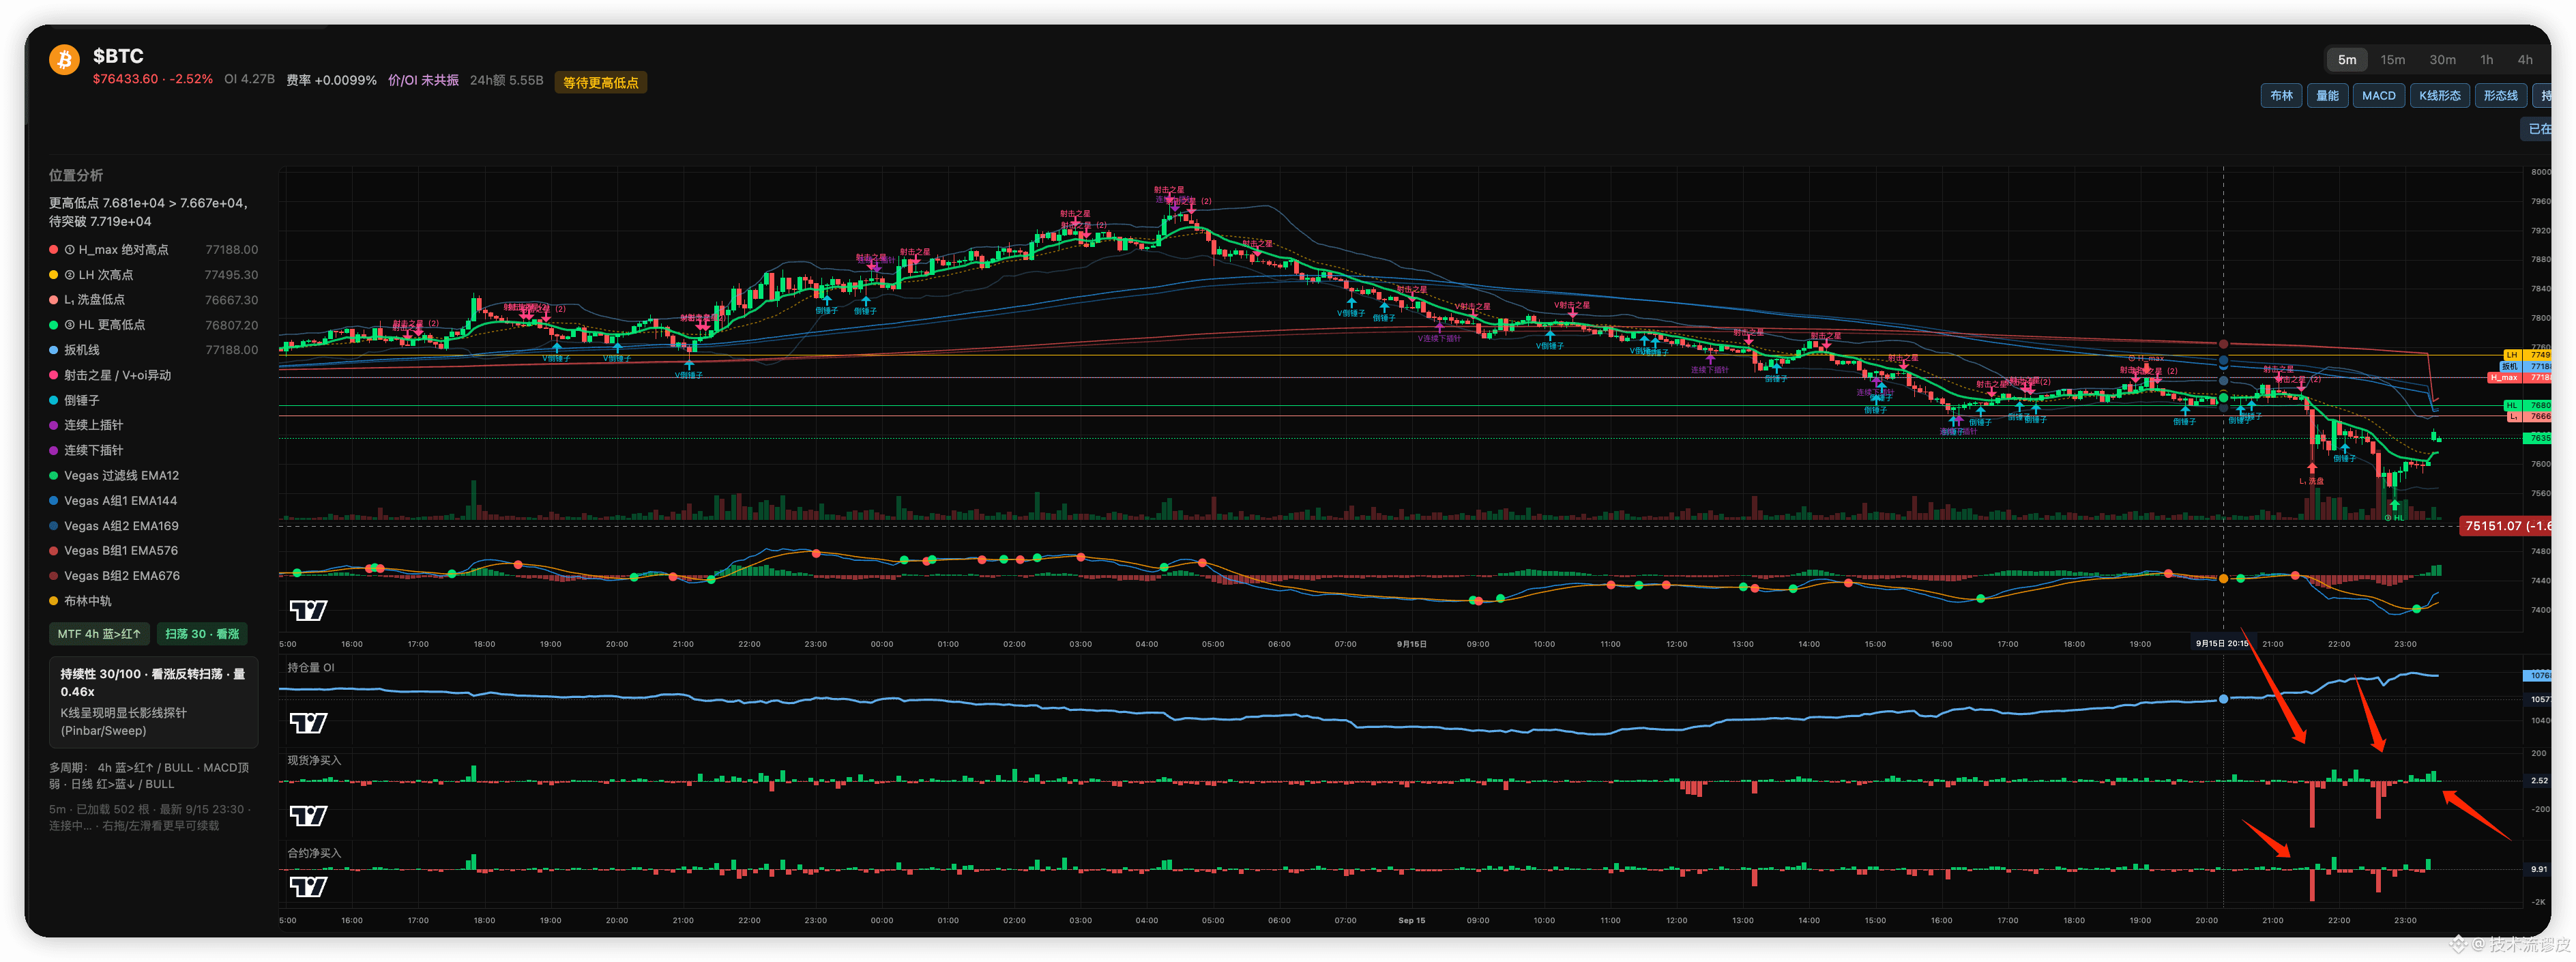
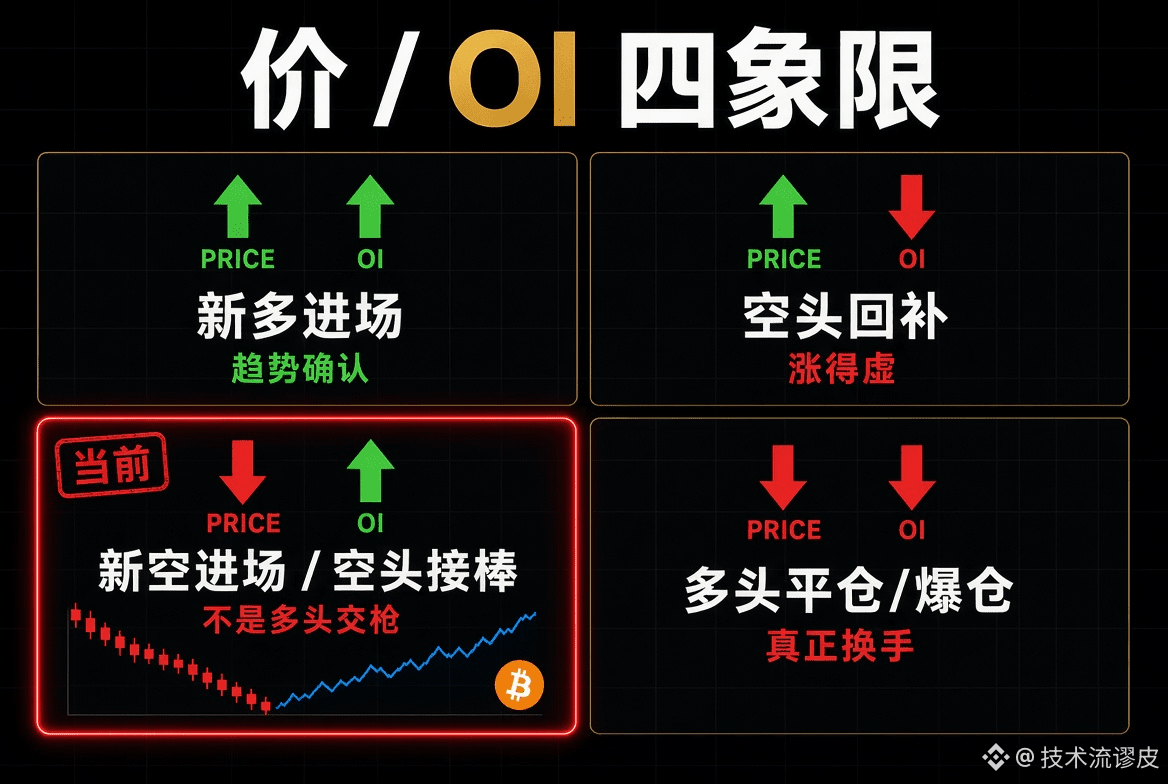
Price is falling while OI is rising—this means it’s not that the old longs are being shaken out. Instead, new shorts are piling in.
Spot and futures net buys turning red at the same time signals that the shorts have begun to take control of the order book.
The sign that the rotation is complete is when OI drops along with the price. Right now, OI is still rising, which means the short side’s ammunition hasn’t been fully used up.
Don’t treat a big bearish candle as a bottom handover ceremony.
The rotation isn’t complete yet. It looks more like the shorts are taking the baton, not the longs handing in their weapons.
A true long/short rotation is usually: a big bearish candle + OI dropping in sync + the longs being swept out of the market.
This chart is the opposite—price is being smashed, while OI is climbing. That indicates it’s not that the old long positions got knocked out and exited; instead, someone is continuing to open new shorts during the downtrend. The old longs haven’t been cleared out completely, and the new shorts are already in.
Paired with the two lower panels—spot net buys and futures net buys turning red—both sides are selling together. This isn’t “bottom rotation completed.” It’s the shorts starting to take pricing power.
Price is falling while OI is rising—this means it’s not that the old longs are being shaken out. Instead, new shorts are piling in.
Spot and futures net buys turning red at the same time signals that the shorts have begun to take control of the order book.
The sign that the rotation is complete is when OI drops along with the price. Right now, OI is still rising, which means the short side’s ammunition hasn’t been fully used up.
Don’t treat a big bearish candle as a bottom handover ceremony.
The rotation isn’t complete yet. It looks more like the shorts are taking the baton, not the longs handing in their weapons.
A true long/short rotation is usually: a big bearish candle + OI dropping in sync + the longs being swept out of the market.
This chart is the opposite—price is being smashed, while OI is climbing. That indicates it’s not that the old long positions got knocked out and exited; instead, someone is continuing to open new shorts during the downtrend. The old longs haven’t been cleared out completely, and the new shorts are already in.
Paired with the two lower panels—spot net buys and futures net buys turning red—both sides are selling together. This isn’t “bottom rotation completed.” It’s the shorts starting to take pricing power.