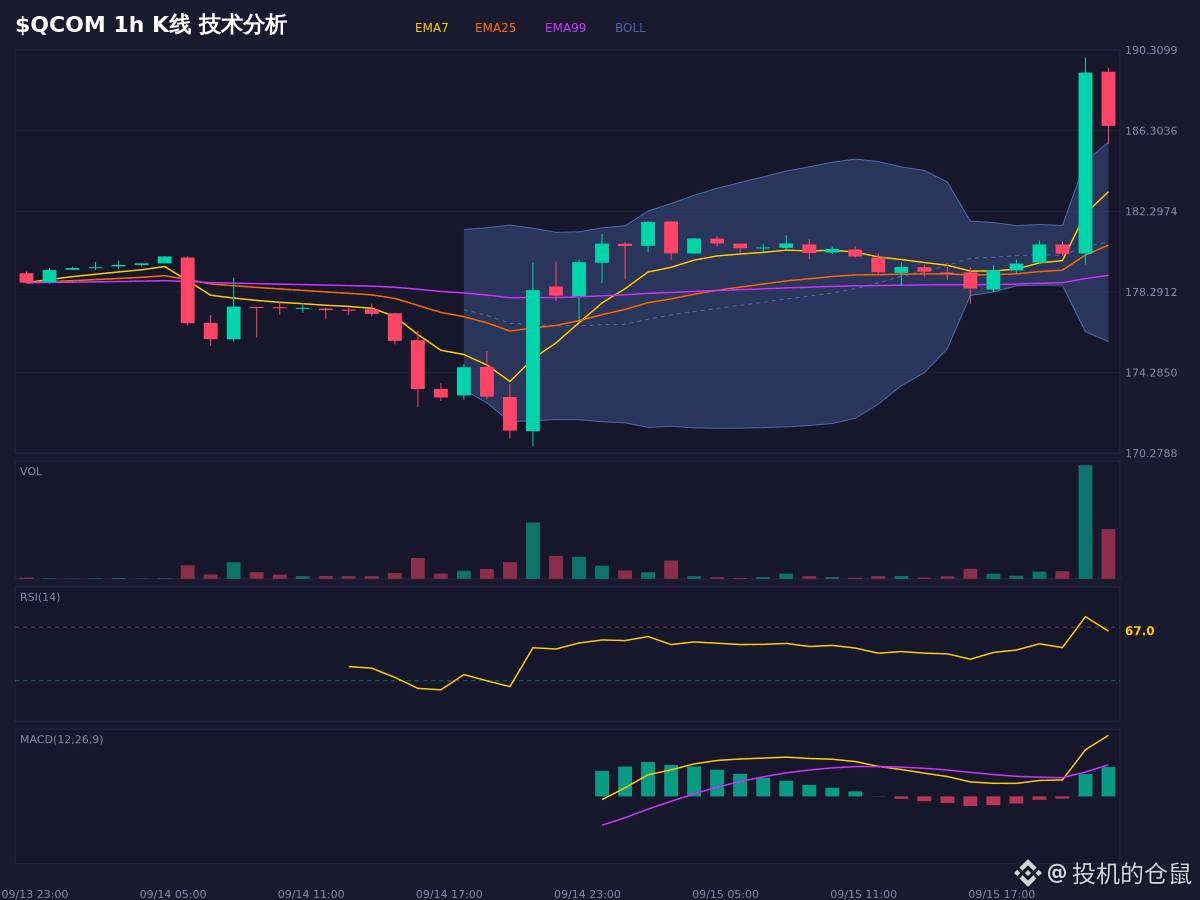
$QCOM Current price 186.56. The price action today really does have something to it. Wow, the moving average system is solidly bullish—EMA7 is about to cross above EMA25, and the trend looks quite strong. But the Stoch RSI indicator is a bit interesting: the candlesticks have crossed below the D line, and the short-term bearish signal is in contradiction with this wave of上涨.
The Bollinger Bands show that the price has already broken above the upper band—this strength is definitely fierce, but it also means there’s a significant pullback pressure. Really—this kind of position chasing in is a bit of a gamble.
Right now we’re watching the range 183.375~184.922. If the Fib retracement pullback zone and the EMA25 confluence area can hold steady, the bullish structure may continue. But if it breaks below 179.6231, then the logic behind this current upswing would be considered completely invalid. The long-vs-short ratio shows that long positions are declining; some people have already started taking profits.
Only for order-book/chart observation and scenario projection, not a record of trading operations.
$QCOM #熊市 #永续合约 #bull market
The Bollinger Bands show that the price has already broken above the upper band—this strength is definitely fierce, but it also means there’s a significant pullback pressure. Really—this kind of position chasing in is a bit of a gamble.
Right now we’re watching the range 183.375~184.922. If the Fib retracement pullback zone and the EMA25 confluence area can hold steady, the bullish structure may continue. But if it breaks below 179.6231, then the logic behind this current upswing would be considered completely invalid. The long-vs-short ratio shows that long positions are declining; some people have already started taking profits.
Only for order-book/chart observation and scenario projection, not a record of trading operations.
$QCOM #熊市 #永续合约 #bull market